Utilization
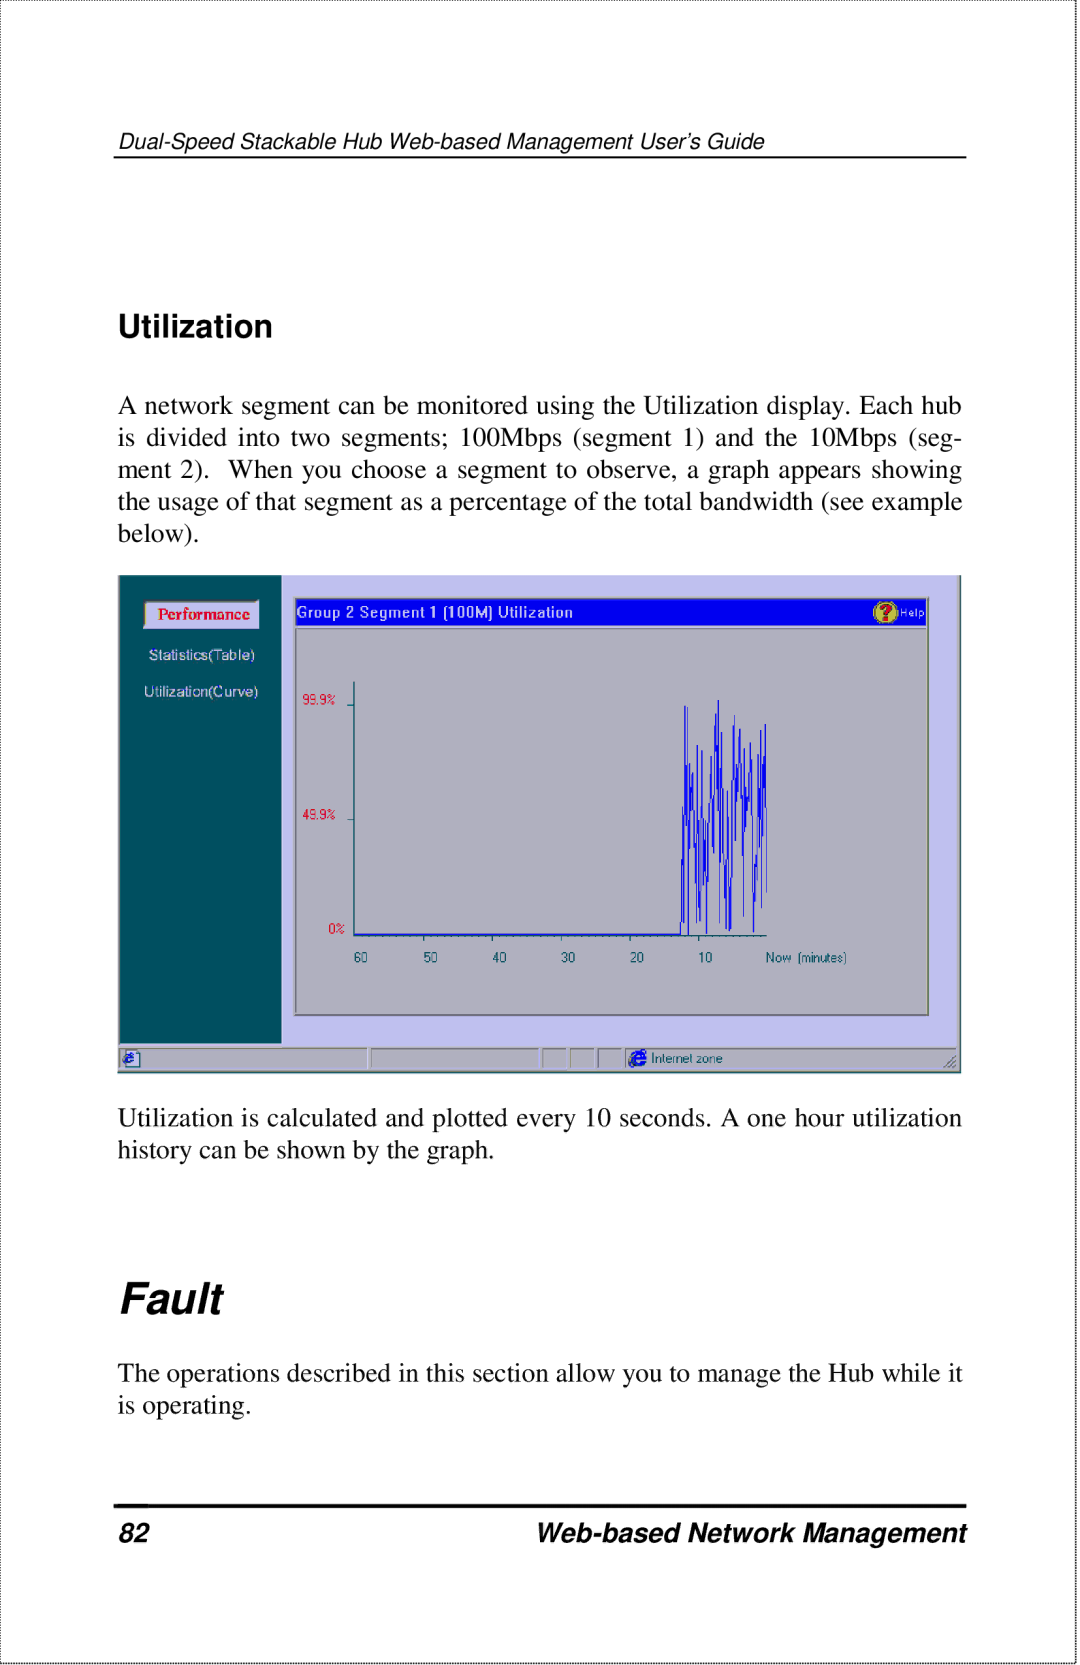
A network segment can be monitored using the Utilization display. Each hub is divided into two segments; 100Mbps (segment 1) and the 10Mbps (seg- ment 2). When you choose a segment to observe, a graph appears showing the usage of that segment as a percentage of the total bandwidth (see example below).
Utilization is calculated and plotted every 10 seconds. A one hour utilization history can be shown by the graph.
Fault
The operations described in this section allow you to manage the Hub while it is operating.
82 |
|