|
|
| Preferences Screen |
|
|
| Preferences Screen |
Table | Alert Events Subtab (Continued) | ||
|
|
|
|
| Column Name | Default | Description |
|
|
|
|
| Target ID * | No | ID of subsystem being attacked, e.g., 02:FILESYSTEM |
|
|
|
|
| Code * | No | Code number of the detection template |
|
|
|
|
| Version * | No | Version of the detection template |
|
|
|
|
| UTC Time * | No | Time of the alert in Coordinated Universal Time |
|
|
|
|
| Details * | No | Details of the alert |
|
|
|
|
Error Events Preferences
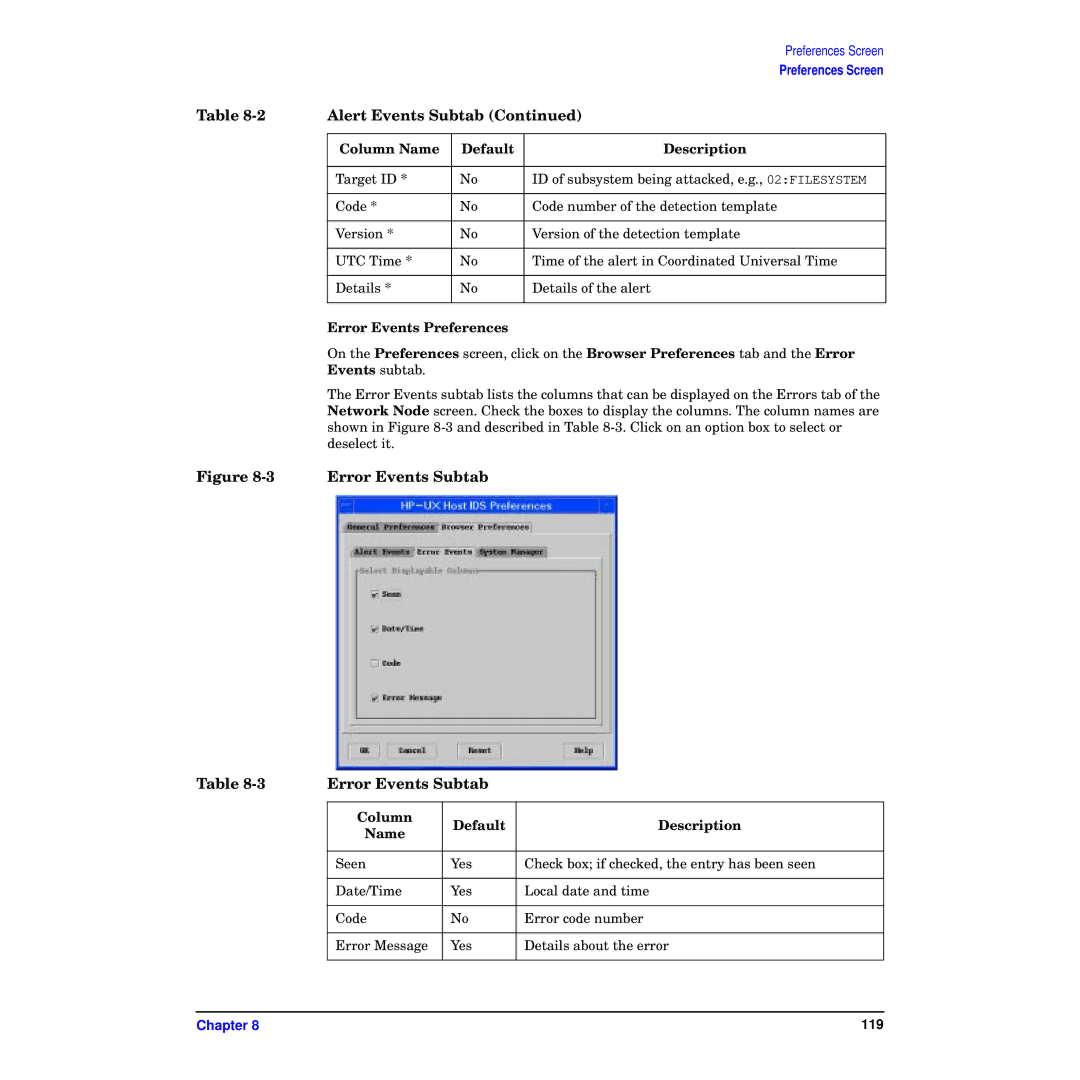
On the Preferences screen, click on the Browser Preferences tab and the Error Events subtab.
The Error Events subtab lists the columns that can be displayed on the Errors tab of the Network Node screen. Check the boxes to display the columns. The column names are shown in Figure
Figure 8-3 Error Events Subtab
Table | Error Events Subtab |
| |
|
|
|
|
| Column | Default | Description |
| Name | ||
|
|
| |
|
|
|
|
| Seen | Yes | Check box; if checked, the entry has been seen |
|
|
|
|
| Date/Time | Yes | Local date and time |
|
|
|
|
| Code | No | Error code number |
|
|
|
|
| Error Message | Yes | Details about the error |
|
|
|
|
Chapter 8 | 119 |
