Preferences Screen
Preferences Screen
System Manager Preferences
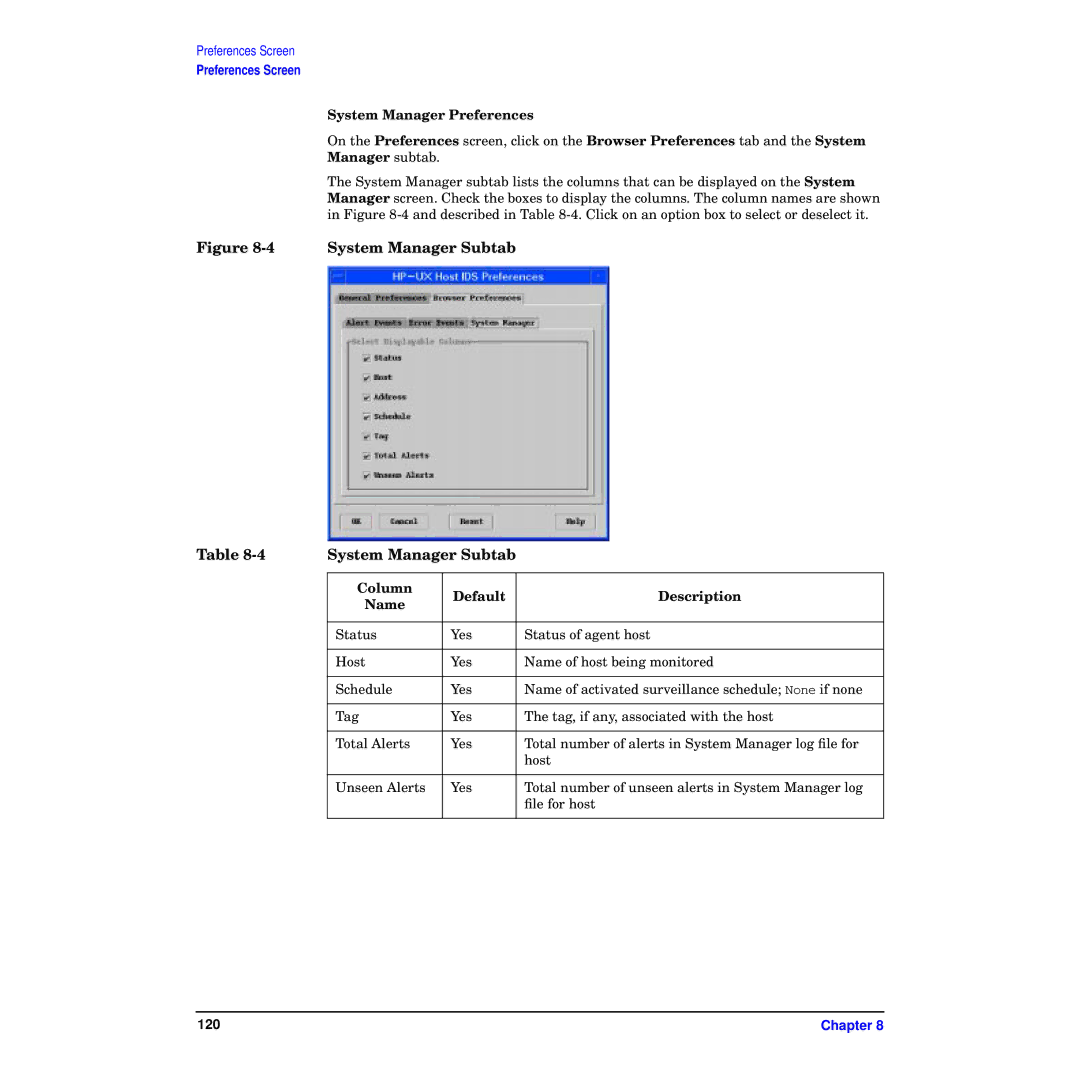
On the Preferences screen, click on the Browser Preferences tab and the System Manager subtab.
The System Manager subtab lists the columns that can be displayed on the System Manager screen. Check the boxes to display the columns. The column names are shown in Figure
Figure 8-4 System Manager Subtab
Table | System Manager Subtab |
| |
|
|
|
|
| Column | Default | Description |
| Name | ||
|
|
| |
|
|
|
|
| Status | Yes | Status of agent host |
|
|
|
|
| Host | Yes | Name of host being monitored |
|
|
|
|
| Schedule | Yes | Name of activated surveillance schedule; None if none |
|
|
|
|
| Tag | Yes | The tag, if any, associated with the host |
|
|
|
|
| Total Alerts | Yes | Total number of alerts in System Manager log file for |
|
|
| host |
|
|
|
|
| Unseen Alerts | Yes | Total number of unseen alerts in System Manager log |
|
|
| file for host |
|
|
|
|
120 | Chapter 8 |
