Netopia Firmware User Guide
Part Number
Contents
Iv Firmware User Guide
Contents
Vi Firmware User Guide
Contents
Viii Firmware User Guide
Contents
Appendix C Binary Conversion Table Index
Universal Plug-and-Play support UPnP See UPnP Support on
What’s New in Netopia Firmware Version
IP Passthrough support
Netopia Console Menus
Console-based Management
Screen differences
Netopia Models
Configuring Telnet software
Connecting through a Telnet Session
Console connection port DB-9 male
Connecting a Console Cable to your Equipment
Mac ANSI, VT-100, or VT-200
PC ANSI-BBS
Navigating through the Console Screens
Firmware User Guide
WAN Configuration
Chapter WAN and System Configuration
Adsl Line Configuration screen is shown below
Adsl Line Configuration screen
SDSL/IDSL Line Configuration screen is shown below
SDSL/IDSL Configuration screen
Data Rate Mode Nokia Fixed Paradyne
Idsl Line Configuration screen is shown below
Idsl Line Configuration screen
G.SHDSL Line Configuration screen is shown below
Shdsl Line Configuration screen
T1 Line Configuration screen is shown below
T1 Line Configuration screen
Frame Relay Options PPP Options
Frame Relay Configuration
LMI Type
Frame Relay Dlci configuration
Displaying a Frame Relay Dlci configuration table
Changing a Frame Relay Dlci configuration
Adding a Frame Relay Dlci configuration
ADD Dlci NOW Cancel
Deleting a Frame Relay Dlci configuration
Multiple ATM PVC configuration
Configuration ATM Circuits Configuration
Multiple ATM Permanent Virtual Circuits
Multiple ATM PVC overview
UBR
Quality of Service QoS settings
WAN and System Configuration
Select Show/Change Circuit and press Return
Editing circuits
Changing a circuit
ATM Sdsl
Monitoring multiple virtual circuits
Select VC Traffic Statistics ATM VC Statistics screen appears
Creating a New Connection Profile
Commit Cancel
Multiple Data Link Encapsulation Settings
You select PAP, CHAP, or None
Information
WAN Configuration
Default Profile Default Profile screen appears
Default Profile
Scheduled Connections
IP parameters default profile screen
Viewing scheduled connections
Adding a scheduled connection
Set Weekly Schedule
Set Once-Only Schedule
Deleting a scheduled connection
Modifying a scheduled connection
System Configuration Screens
System configuration features
Network Address Translation NAT
IP Setup
Filter Sets
IP Address Serving
Stateful Inspection firewall
Stateful Inspection Options
Enable and configure stateful inspection on a WAN interface
WAN and System Configuration
Exposed Addresses
TCP
Date and time
Security
Upgrade Feature Set
Console Configuration
Snmp Simple Network Management Protocol
RFC-1483 Transparent Bridging
WAN and System Configuration
Logging
PPP PAP we accepted remote, Channel 1 Remote name guest
Firmware User Guide
Overview
Chapter Multiple Network Address Translation
Static mapping
Features
Port Address Translation
Server lists
Dynamic mapping
WAN Network
Complex maps
Supported traffic
Support for Microsoft Network MSN Messenger
Support for AOL Instant Messenger AIM File Transfer
MultiNAT Configuration
Easy Setup Profile configuration
Server Lists and Dynamic NAT configuration
IP Address Serving
NAT rules
Add NAT Map List Map List Name
Select
Public Range Type is Pat Public Range Start Address is
Show/Change NAT Map List screen appears
Modifying map lists
Change NAT MAP
Adding Server Lists
ADD NAT Server
Port
Show/Change NAT Server List screen appears
Modifying server lists
Change NAT Server
Deleting a server
IP profile parameters
Binding Map Lists and Server Lists
+--NAT Map List Name
Toggle Address Translation Enabled to Yes
IP Parameters WAN Default Profile
IP Parameters Default Profile
NAT Associations
NAT Associations +NAT Map List Name-+
IP Passthrough
Easy-PAT List
First Come First Serve Mode
Restriction
MultiNAT Configuration Example
Previous Screen
Enter your ISP-supplied values as shown below
Change NAT Public Range
ADD NAT MAP
Multiple Network Address Translation
Firmware User Guide
Chapter Virtual Private Networks VPNs
Transit Internetwork
Summary
Pptp configuration
Configuration Add Connection Profile
About Pptp Tunnels
Chap
Firmware User Guide
About IPsec Tunnels
Atmp configuration
About Atmp Tunnels
DES
Encryption Support
MS-CHAP V2 and 128-bit strong encryption
ATMP/PPTP Default Profile
Data Compression None
QuickView
VPN QuickView
Dial-Up Networking for VPN
Installing Dial-Up Networking
Creating a new Dial-Up Networking profile
Configuring a Dial-Up Networking profile
Windows 95 VPN installation
Installing the VPN Client
Windows 98 VPN installation
Allowing VPNs through a Firewall
Connecting using Dial-Up Networking
Filter Sets Display/Change Basic Firewall
Pptp example
GRE
Atmp example
Virtual Private Networks VPNs
UDP
LAN IP 192.168.1.0/24 PC # a Router a 100
Windows Networking Broadcasts
Example
Configuration for Router a
Virtual Private Networks VPNs
Firmware User Guide
Internet Key Exchange IKE IPsec Key Management for VPNs
Internet Key Exchange IKE Configuration
Main Menu Add Connection Profile screen appears
ADD PH1 Profile
Adding an IKE Phase 1 Profile
ADD IKE Phase 1 Profile Cancel
Options
Internet Key Exchange IKE IPsec Key Management for VPNs
Changing an IKE Phase 1 Profile
Key Management
Commitcancel
Internet Key Exchange IKE IPsec Key Management for VPNs
Enhanced Dead Peer Detection
Ping retry interval Ping reply timeout
Multiple Network IPsec
Internet Key Exchange IKE IPsec Key Management for VPNs
Host
+24
IPsec WAN Configuration Screens
IPsec Manual Key Entry
Select IPsec Manual Keys and press Return
VPN Quickview
WAN Event History Error Reporting
Firmware User Guide
Chapter IP Setup
IP Setup
IP Setup
IP subnets
For example
Static routes
Static Routes screen will appear
Viewing static routes
Adding a static route
Deleting a static route
Rules of static route installation
Modifying a static route
Key management
RIP-2 MD5 Authentication
Authentication configuration
Overview
IP Setup screen appears
Ethernet LAN RIP Options
IP Setup
Select Add Key. The Add Key Screen appears
Firmware User Guide Adding a key
Changing or deleting a key
Connection Profiles and Default Profile
IP Address Serving
Power interruptions
Main System Menu Configuration IP Address Serving
Page
IP Address Serving IP Address Serving Mode
IP Address Pools
IP Setup
Dhcp NetBIOS Options
NetBIOS Type
More Address Serving Options
Configuring the IP Address Server options
Scroll UP
192.168.1.112 192.168.1.113 Scroll Down Lease Management
192.168.1.101
Dhcp
Dhcp Relay Agent
Dhcp Relay Agent
Connection Profiles
Easy-PAT List
Multicast Forwarding
Main Menu System Configuration
Firmware User Guide
Chapter Line Backup
Configuring External Dial Backup
External Dial Backup Support
Choose Interface to Configure screen appears
Main Menu WAN Configuration
Serial Port Configuration Serial Port Mode
Backup Configuration screen
Firmware User Guide
Connection Profiles
Using Scheduled Connections with Backup
ADD Scheduled Connection
Scheduled Connections screen appears
Management/Statistics
Force Backup
Event Logs
QuickView
Snmp Support
Backup Default Gateway
Configuration Advanced Connection Options Backup
Backup Configuration screen appears
For more information on IP Setup see the IP Setup on
IP Setup screen
Backup Management/Statistics
QuickView
Firmware User Guide
Explanation of terms
Introduction
Voice Configuration screen appears
Configuring the Voice Features
Voice Configuration Voice Gateway
Firmware User Guide
Quick View Status Overview
Chapter Monitoring Tools
ATM Sdsl WAN
General status
Status lights
Current status
Event Histories
Statistics & Logs
Device Event History
WAN Event History
Device Event History Current Date
Main Menu Statistics & Logs
IP Routing Table
General Statistics
Network Interface
Physical Interface
System Information
ATM ATM TC RFC2514 ATM MIB RFC2515
Simple Network Management Protocol Snmp V2c
Enterprise-specific Snmp Changes
Snmp
Snmp Setup screen
Community strings
Snmp traps
Deleting IP trap receivers
Setting the IP trap receivers
Viewing IP trap receivers
Modifying IP trap receivers
Firmware User Guide
Suggested Security Measures
Chapter Security
UPnP Support
Console Tiered Access Two Password Levels
Superuser configuration
Limited user configuration
Advanced Security Options
LAN WAN
User access password
Main Menu
User menu differences
WAN Configuration screens
User Access Level
Connection Profiles
System Configuration menu
IP Setup menu
Statistics & Logs menu
Utilities & Diagnostics menu
Modem File Transfer menu
Global Voice
ATM Circuits Configuration menu
Quick Menus
ATM Circuits Configuration menu screen appears as follows
User Accounts
Protecting the configuration screens
Protecting the Security Options screen
Telnet Access
How filter sets work
About Filters and Filter Sets
What’s a filter and what’s a filter set?
Forward
Filter priority
filtering rule
How individual filters work
Who 513
Parts of a filter
Port numbers
161 Aurp AppleTalk 387
Other filter attributes
Port number comparisons
User Datagram Protocol
Putting the parts together
Internet Control Message Protocol
Transmission Control Protocol
Filtering example #2
Filtering example #1
Disadvantages of filters
Design guidelines
Working with IP Filters and Filter Sets
An approach to using filters
Naming a new filter set
Adding a filter set
Netopia Router
Adding filters to a filter set
ADD this Filter NOW Cancel
Modifying filters
Viewing filters
Moving filters
Deleting a filter set
Sample filter set
Deleting filters
TCP Icmp UDP
Possible modifications
Policy-based Routing using Filtersets
New filterset screen appears as follows
TOS field matching
ADD this Filter NOW
Basic protocol types
Firewall Tutorial
General firewall terms
Basic IP packet components
Firewall Logic
Firewall design rules
Example TCP/UDP Ports
Implied rules
Binary representation
Logical and function
This is an example of the Netopia filter set screen
Filter basics
Established connections
Example filter set screen
Example network
Example filters
Example
Example
Configuration Management
Savecancel
Boot from a Configuration Backup Config
Tftp
Tftp and X-Modem
Call Filtering
ANY ADD this Filter NOW
Firmware User Guide
Chapter Utilities and Diagnostics
Ping
Receive return Ping packet
Stop Ping
Trace Route
Telnet Client
Transferring Configuration and Firmware Files with Tftp
Factory Defaults
Updating firmware
Downloading configuration files
Uploading configuration files
Transferring Configuration and Firmware Files with
Send Config to Netopia Send Configuration
Downloading configuration files
Restarting the System
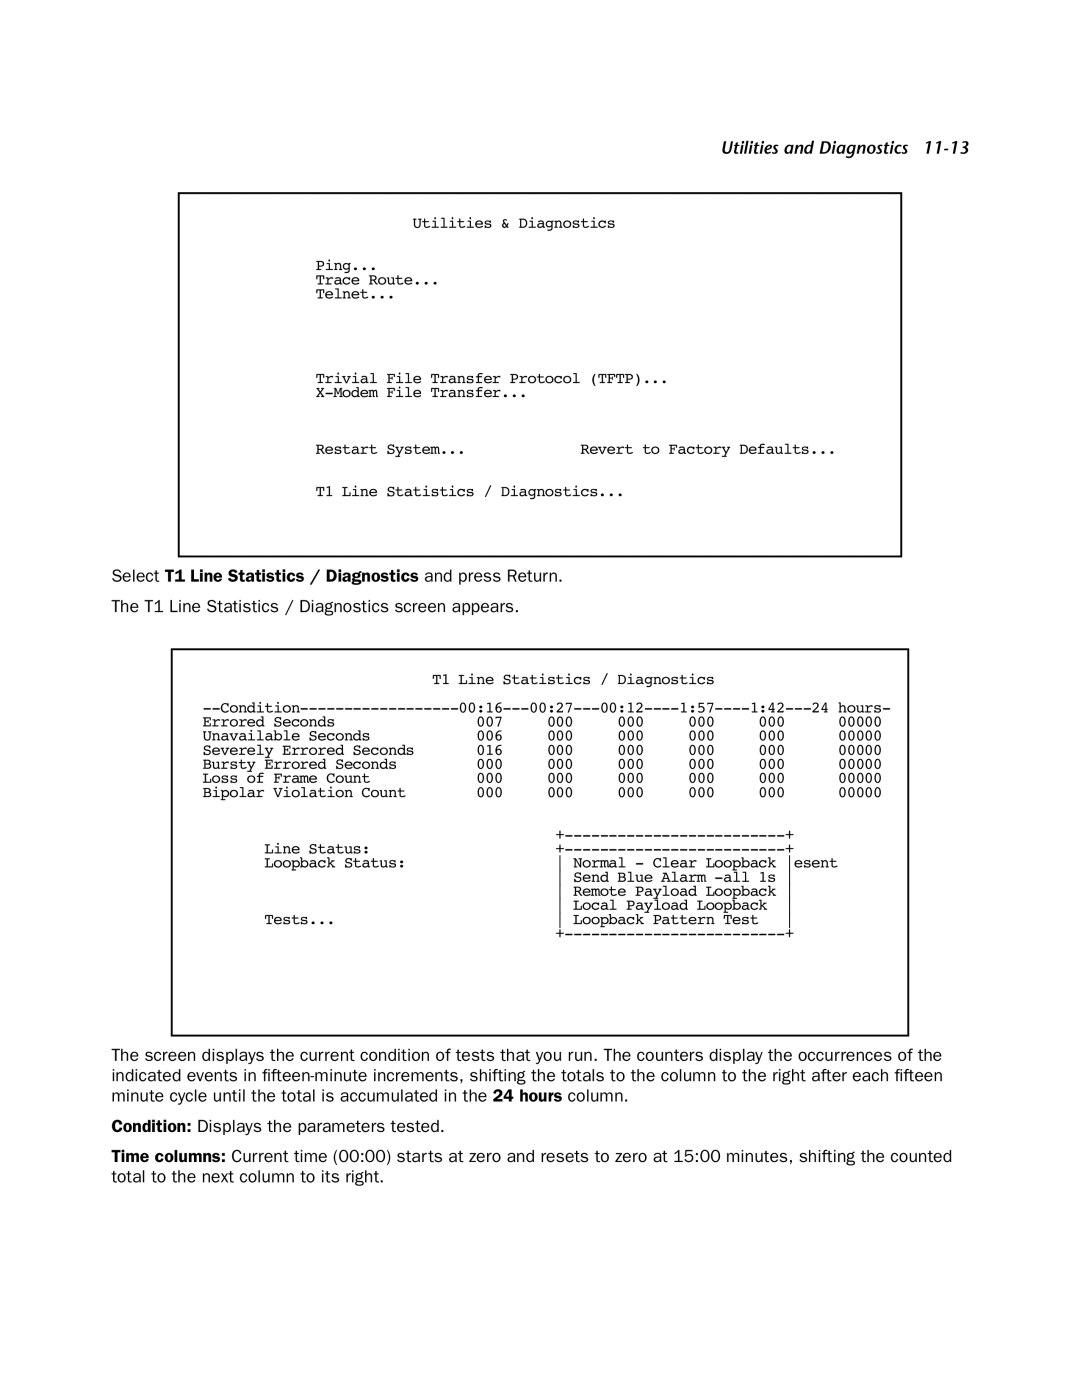
T1 Line Statistics and Diagnostics
T1 Line Statistics / Diagnostics
Firmware User Guide
Configuration Problems
Appendix a Troubleshooting
Network problems
Console connection problems
Power Outages
How to Reset the Router to Factory Defaults
Environment profile
How to reach us
Technical Support
Before contacting Netopia
About IP Addressing
What is IP?
Subnets and subnet masks
Subnet masks
Example Using subnets on a Class C IP internet
Customer Site a
Network configuration
Background
Distributing IP Addresses
Example Working with a Class C subnet
255.255.255.224
Technical note on subnet masking
255.255.255.0
Netopia Firmware Version 5.4 Dhcp server characteristics
Configuration
Dhcp address serving
Serve dynamic WAN clients
Using address serving
Manually distributing IP addresses
MacIP serving
Understanding IP Addressing B-9
Tips and rules for distributing IP addresses
Dhcp example
Nested IP Subnets
Internet
Understanding IP Addressing B-13
Packet header types
Broadcasts
Appendix C Binary Conversion Table
Decimal Binary
Index
Encryption 4-3,4-7,4-10,5-1
IPsec 4-3,4-7,5-1
Routing tables IP 6-6,9-7
WAN
Index-6