Chapter 3 Operation | |
|
|
Note The Usage column describes the System Usage per bundle. The total of all bundle usages is the System Usage displayed in the Bundle Connection Configuration screen (Figure
Monitoring System Performance
Main Menu | ➤ To view performance statistics: |
↓ | |
3. Performance | • Type 3 (Performance Monitoring) in the Main menu. |
Monitoring |
|
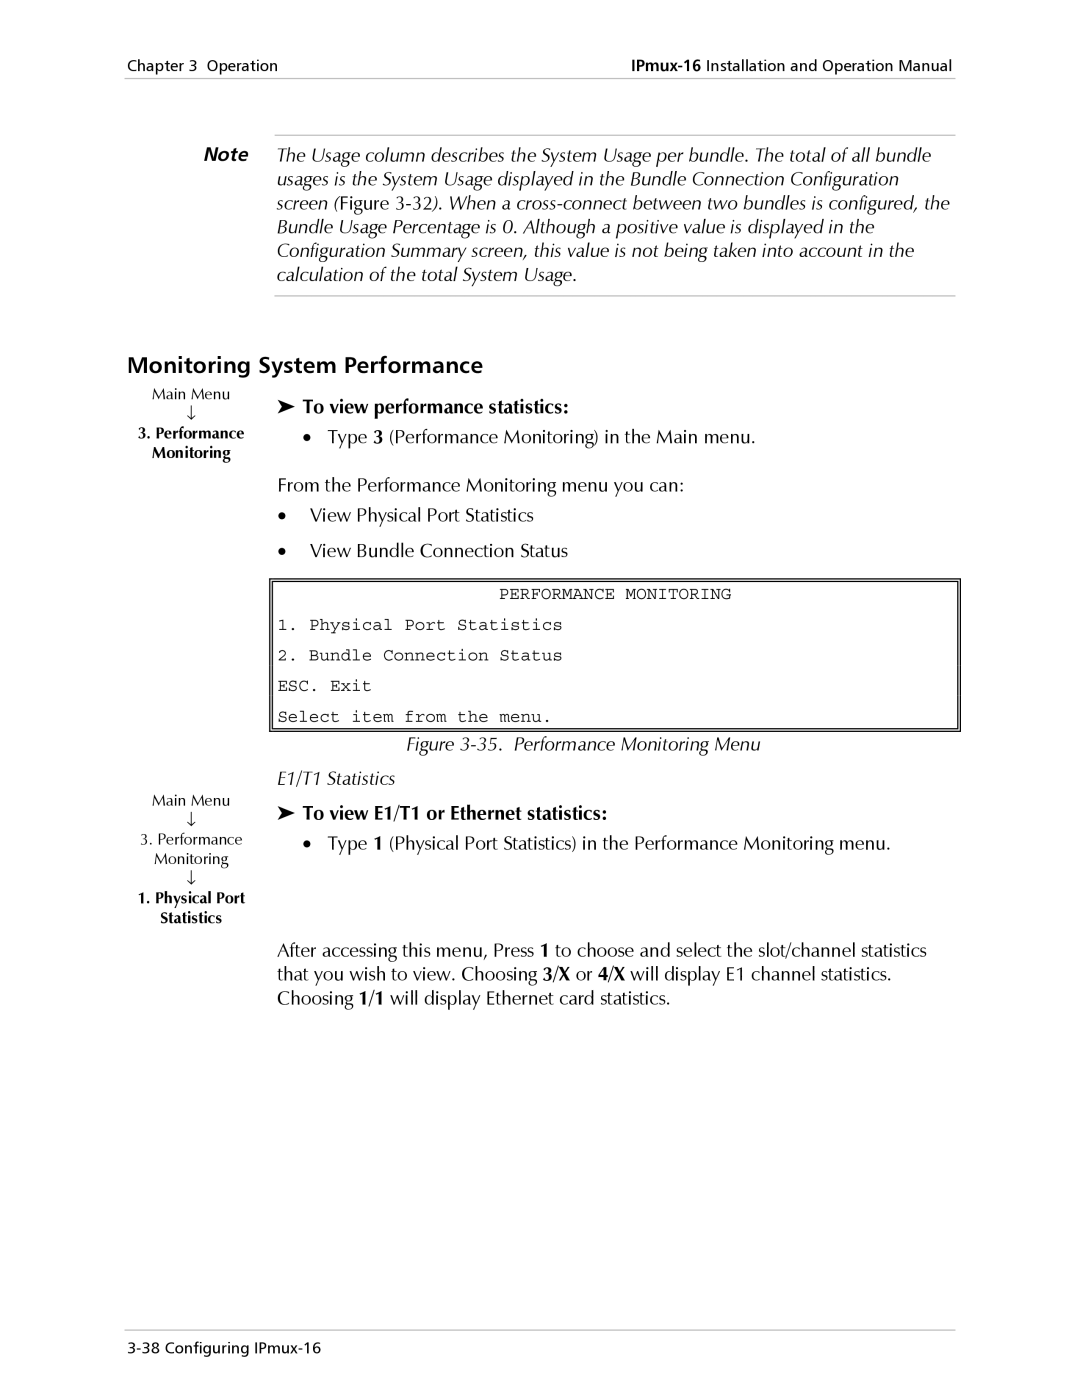
From the Performance Monitoring menu you can:
•View Physical Port Statistics
•View Bundle Connection Status
PERFORMANCE MONITORING
Main Menu
↓
3.Performance Monitoring
↓
1.Physical Port Statistics
1.Physical Port Statistics
2.Bundle Connection Status ESC. Exit
Select item from the menu.
Figure 3-35. Performance Monitoring Menu
E1/T1 Statistics
➤To view E1/T1 or Ethernet statistics:
• Type 1 (Physical Port Statistics) in the Performance Monitoring menu.
After accessing this menu, Press 1 to choose and select the slot/channel statistics that you wish to view. Choosing 3/X or 4/X will display E1 channel statistics. Choosing 1/1 will display Ethernet card statistics.
