Field Panel Web Server User Guide
Building Technologies
Page
Table of Contents
Trend View
Graphics View
Point Log Report
Schedule View
FLN
137
160
171
Copyright Notice
To the Reader
Credits
Related Documents
How to Use This Manual
Symbols Used in this Manual
Manual Conventions
Contact Us
Convention Examples
Introduction to Field Panel Web Server
Applications
Point Log Report
Smtp Configuration Editor
Schedule/Command/Calendar Object Editors
Event Enrollment Editor
FLN Device Editor
Change User Password
Ppcl Editor
TEC Initial Value Editor
Prerequisites
Field Panel Web Server System Administration
Chapter Overview
Browser Requirements
Enabling or Disabling Web Server
Verifying that Adobe Flash has been Installed
Prerequisites for FINlite Graphics Tool
Click Manage Add-ons
Example
Loading the User Interface
Performance and Limitations
Tips to Improve Performance of Field Panel Web Server
Allow Browser Caching of Adobe Flash Player
Click Settings
System Security
Limit Open Tabs to Six
Language Support
Importing a Language File
User Interface Navigation Overview
Welcome Page/Logon
Steps for Logging On
Configuring the Welcome Page Graphic
User Interface after Logon
Status Bar User Interface
Navigation Pane User Interface
User Interface Navigation Overview
Inaccessible Panels on the ALN
Device/Points Bar Icons and Messages
Discovering the Database
Inaccessible Panels
Pending Database File Synchronization
Application Area User Interface
Device/Points Navigation Tree
Search Box
Panel List
User Interface Navigation Overview
Exporting, Saving, and Printing an Alarm Report
Running an Alarm Report
Acknowledging an Alarm
Status Bar
Setup
Selecting the Language
Logoff
Status Bar
Point Commander
Point Commander Application Overview
Point Commander Application Overview
Command Options and Status
Point Name and Description
Status Indicators
Advanced Command Options Points with Priority Array
Dynamic Trending
Command Feedback
Error Code
Using the Point Commander Application
Tips for Using the Point Commander Application
Commanding Point Values
Release All Commanded Points
Disabling and Re-enabling a Point Out-of-Service
Steps for Commanding Point Values
Steps for Disabling/Re-enabling a Point
Steps for Changing Point Priority Basic Commanding Window
Priority Arrays
Release All Commanded Points
Graphics Features
Tips for Using the Graphics View
Using the Graphics View
Graphics View
Graphics File Types
Graphics File Navigation
Graphics View
Point Log Report
Point Log Report Application Overview
Using the Point Log Report Application
Running a Point Log Report
Querying and Filtering a Point Log Report
Generating a Point Log Report
Exporting, Saving, and Printing a Point Log Report
Trend View
Using the Trend View
Tips for Using the Trend View Application
Trend View Overview
Using the Trend View
Viewing Trend Data of Multiple Trended Points
Printing a Trend Graph
Vertical Access Values
Customizing a Trend Graph
Dynamic Display
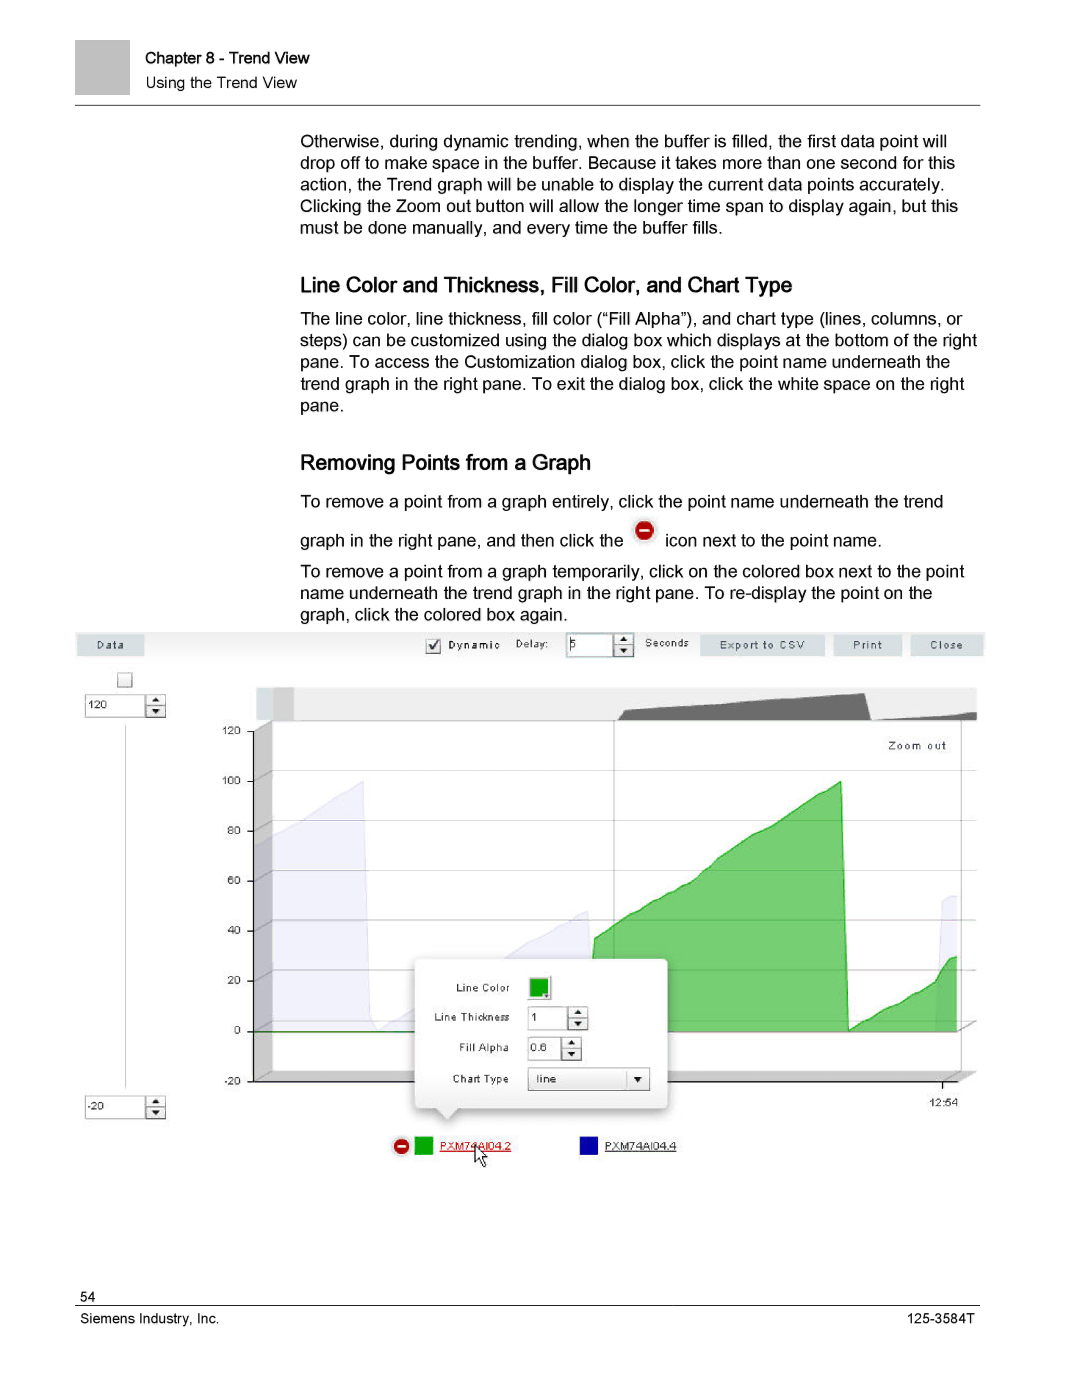
Line Color and Thickness, Fill Color, and Chart Type
Removing Points from a Graph
Schedule View
Scheduler Application Overview
User Interface Description for the Scheduler Application
Using the Scheduler Application
Tips for Using the Scheduler Application
Schedule View
Create/Edit
Common Editor Fields and Buttons
Object Identifier
Object Reference
Trend Application Overview
Trend
Section Overview
Common Editor Buttons and Functions
User Interface Description for the Trend Editor Application
Off-Node Trending
Create/Edit
Using the Trend Editor Application Creating a Trend Object
Modifying a Trend Object
Viewing a Trend Object
Point
Deleting a Trend Object
Point Editor Application Overview
User Interface Description for the Point Editor Application
Tips for Using the Point Editor Application
Using the Point Editor Application Creating a Point
Intrinsic Alarming
Modifying a Point
Viewing a Point
Deleting a Point
Schedule/Command/Calendar
Schedule/Command/Calendar Object Editors Overview
Schedule Object Editor User Interface
Command Object Editor User Interface
Calendar Object Editor User Interface
Tips for Using Schedule/Command/Calendar Object Editors
Creating a Schedule ObjectNotReleased
Creating a Weekly ScheduleNotReleased
Creating a Schedule ExceptionNotReleased
Create/Edit
Command Point ObjectsNotReleased
Modifying a Schedule ObjectNotReleased
Viewing a Schedule ObjectNotReleased
Command Objects
Deleting a Schedule ObjectNotReleased
Creating a Command ObjectNotReleased
Modifying a Command ObjectNotReleased
Viewing a Command ObjectNotReleased
Deleting a Command ObjectNotReleased
Calendar Objects
Creating a Calendar ObjectNotReleased
Modifying a Calendar ObjectNotReleased
Viewing a Calendar ObjectNotReleased
Deleting a Calendar ObjectNotReleased
User Interface Description for the Event Enrollment Editor
Event Enrollment
Event Enrollment Overview
Click the Event Enrollment icon
Create/Edit
Tips for Using the Event Enrollment Editor
Type-specific Parameters
Modifying an Event Enrollment Object
Click the Event Enrollment icon from the Create/Edit bar
Viewing an Event Enrollment Object
Running an Alarm ReportNotReleased
Deleting an Event Enrollment Object
Status Bar Counts and Reports
Acknowledging an AlarmNotReleased
Notification Class
100 Siemens Industry, Inc
101
Using the Notification Class Editor
Creating a Notification Class Object
Modifying a Notification Class Object
Viewing a Notification Class Object
Remote Notification
Deleting a Notification Class Object
Smtp Configuration Section Overview
Smtp Configuration Editor Overview
Using the Smtp Configuration EditorNotReleased
107
Creating a Heartbeat Message
Remote Recipient List
Using the Remote Recipient List EditorNotReleased
Remote Recipient List Editor Overview
Creating a Remote RecipientNotReleased
Modifying a Remote RecipientNotReleased
Deleting a Remote RecipientNotReleased
Replicating a Remote Recipient ListNotReleased
FLN Device Editor Overview
User Interface Description for the FLN Device Editor
113
Tips for Using the FLN Device Editor
Using the FLN Device Editor Creating an FLN Device
Modifying an FLN Device
Viewing an FLN Device
TEC Init
Deleting an FLN Device
TEC Initial Value Editor Overview
User Interface Description for the TEC Initial Value Editor
Using the TEC Initial Value Editor Setting the Initial Value
The TEC Initial Values Editor window displays
Updating the Panel
Initializing
Releasing Points
Ppcl Editor Overview
User Interface Description for the Ppcl Editor
123
Enable or Disable Ppcl Lines
Tips for Using the Ppcl Editor
Using the Ppcl Editor Creating a Ppcl Program
The Enable Lines or Disable Lines window displays
Modifying a Ppcl Program
Viewing a Ppcl Program
Users
Deleting a Ppcl Program
User Interface Description for the User Account Editor
User Info Tab
Permissions Tab
130 Siemens Industry, Inc
Using the User Account Editor
Creating a User Account
Modifying a User Account
Viewing a User Account
Click the Change UserPassword icon in the Create/Edit bar
Change User Password
Changing a Password
Deleting a User Account
Change Panel Time
User Account Passwords Using Double Byte Character Sets
Changing an Expired Password
New User Account
136 Siemens Industry, Inc
FINlite Graphics Tool
FINlite Graphics Tool Overview
User Interface Description for the FINlite Graphics Tool
Graphics Application Workflow
File Menu
Edit Menu
View Menu
Language Dropdown
Question Mark Icon
Panels Bar
Components Bar
Layers Bar
Properties Bar
Animation Editor
File-System & User Library Bar
Canvas
Tips for Using the FINlite Graphics Tool
Using the FINlite Graphics Tool
Launching the FINlite Graphics Tool
Logging in to the Controller
Creating Graphics
Button Component
To create a Model
Label Component
To bind a button to a point
To bind a button to a graphic
To bind a button to a Schedule Object
To bind a button to a Trend Log Object
To bind a button to a Web
To Publish a Graphics File
Editing the Graphics Animation
To create a Graphics file
To Edit the Animation
Saving and Publishing the Graphics File
To save the Graphics file
To publish the Graphics file
To Relativize a Graphics File
Default Graphics
Creating Device Templates
From the File menu, select Create Device Template
Click Relativize
Backing Up Graphics
Field Panel Web Server User Interface
Deleting Graphics Files
Deleting Graphics Files
Example Deleting a Graphic from the Field Panel Web Server
Deleting Graphics Files from All Locations
Viewing Directory Structure
Verifying Graphic before Deleting from IFD Directory
Deleting Graphics
Updating the FINlite User Guide
Deleting the Same Graphic from Drive A\
159
Field Panel File System Operations
Field Panel Features for Field Panel Web Server
Basic File System Operation Commands
Set Drive
List Drives
Rename a File
List Files in a Directory
Delete a File
Move a File
Copy a File
Examples
Remove a Directory
Wildcard Example
Backing up and Restoring Databases
IFD
To enable the Auto Save feature via the HMI
Enabling Auto Save
Available Memory Diagnostic Point
Troubleshooting
General Troubleshooting Tips
Clear the UI Cache
Account Expired
Log On Error Messages
Clear the FINlite Cache
Windows XP
No Web Server Access
Install, Upgrade, and Connection Errors
Login has Failed
Account is Locked
Browser Will Not Connect to the Panel
Field Panel Web Server User Interface Upgrade Fails
Error Accessing Panel Message
Empty Browser Window
User is Unable to Log in to Panel via FINlite
Graphics Issues
Displaying New Graphics in Browser
Graphics Files do not Save Properly
Other Issues
Issued by Copyright Siemens Industry, Inc