Page
3MTM SoundPro Sound Level Meter
Table of Contents
Turning on
Setting up auto-run
Locking setup or run mode
Digital outputs/Triggering
Communications
Calibrate
Running a session/study Measurement navigation
Measurement screen icons
Measurement screens
Curves Captured curves
Criterion curve families
Audiometric background curves
Running and viewing curves
Configuration directory
Viewing Past Measurements
Files
File directories
Specifications
Mechanical characteristics
Electrical characteristics
Special features
133
134
AC/DC jack 135
Selecting measurements with Lookup softkey
STI-PA setup screen
Selecting past study data review mode
Saving/Creating setup file config. file
Viewing, loading, deleting setup files
This page left blank intentionally
Models and options
SoundPro Models SE and DL and Option 1 and Option
Frequency resolution
Octave bands
Level
Third -octave bands
Naming bands
Acoustical range bands
Exact Center Names of Octave
Physical Characteristics
Logging explained
Analysis type
Display
Hardware interfaces
Memory card slot
USB port
Power jack
AC/DC port
Auxiliary port
Screen contents
Information screen
Detection Management Software DMS
DMS Start
Navigational buttons
This page left intentionally blank
Optional feature
Checking the equipment
Preamp SoundPro Microphone
USB cable
Microphone and accessories
Installing the preamp
Connecting an extension cable
Class/Type 1 and Class/Type 2 instrument
Windscreen
Class/Type 2 microphones Remove
Providing power
Installing Batteries
To install batteries
Battery power explained
Checking or changing type
Battery Check screen
Setup
Softkey buttons
Using power supply or auto adapter
Base or bottom of SoundPro
Turning on
Start screen and the keypad
SoundPro functionality
Keypad explained
Indicators explained
Screen Indicators
Icon Significance
Turning off
Navigating
Arrows and left/right arrows are primarily used
This page left blank intentionally
Basic setups
Basic setups
Signal Input BK4936 QE7052 QE4110 QE4130 QE4150 QE4170
Required microphone settings
Changing microphone settings
Microphone settings
Changing time and date settings
Time and date
Setting Measurement type
Measurement type SLM, 1/1, 1/3, STI-PA, RT60
1st softkey
Meter 1/Meter 2 Parameters i.e. response time, weighting
Setting up Meter 1 and/or Meter 2 parameters
Measurement setup for community noise
Setting up community noise measurements refer to -5 below
Data fields
Measurements Explanation
Measures screen explained
Measurement settings
Meter
Logging
Logging options
Exceedance level
Filters
Setting logging options
Enabling or disabling logging options
Exceedance options
Filters
Setting up display options
9Display setup screen
\setup\display\LANGUAGE
Language
Changing the language
Fran çAIS
Setting or viewing Backlight options
Backlight settings
Backlight
Contrast setting
Contrast
Changing the contrast on the display
Advanced setups
Setting up auto-run
Date setting
Setting up or changing auto-run with date parameter
Auto-Run
Time settings
Auto-Run #1
Days of week setting
Setting the Date of Week DOW
Day of the Week DOW setup
Auto-Run AR #1 settings
Auto-run shutdown screen
Auto-run shutdown screen explained
Mode
Timed run setting
Viewing or changing the Timed Run setup
Timed-Run
Duration
Level-triggered auto-on setting
Viewing or changing level-triggered mode
Level Explanation of Settings Triggered
Level- Explanation of Settings Triggered
Level Triggered Auto-On settings explained
Either Run/Pause or Run/Stop
Action
Locking setup or run mode
Setting secure run or secure setup locking
About Secure Setup
About Secure Run
Setting secure run or secure setup locking
Setting Lock feature
Lock
Press Enter to Enable
10 Adding code for secure/lock screen
Disabling secure run or secure setup unlocking
Secure code backup number
From Secure Run or Secure Setup screen
From the Start screen
To enable Run/Pse or disable Off run tracking
Digital outputs/Triggering
Tracking runs
Enabling or Disabling run/pause digital outputs/triggers
Communications
Digital outputs and SPL
Managing SPL digital outputs See -13 above
QSP/Serial
Mass Storage
Viewing real-time measurements remotely
USB communications
Turning on log to port
LOG to Port
GPS display
GPS explained
Enabling GPS communications
18 Viewing GPS coordinates in COMM-Set screen
This page left blank intentionally
Virtual meters
Measurement notation IEC/ISO
Meter 1/Meter 2 explained
Notation Explanations
Overview of running a session/study
Quick Help List
Preparing to measure
Sessions and Studies
Storing Data Explanations
Sessions and studies explained
Measurement range
Calibrate
Calibration screen
Pre-Calibration
Post-Calibration
Performing a calibration
Calibrating
Microphone Place calibrator over microphone Cal Adapter
QC10/QC20
Setting pre-cal screen
Running a session/study
Running a session/study
Post-Cal
Measurement navigation
Measurement screens explained
Analysis type, time response and weighting
Changing displayed measurement
Changing displayed measurement
Selection Panel
Measurement screen icons
Descriptor types
Measurement icons and screen descriptors explained
Viewing Explanations Descriptors
Bar Chart and Filtered Bar Chart
Bar Chart View
Softkeys menus options Broadband Bar Chart view
Measurement screens
Community Noise screen
Exceedance levels
Community Noise View
Taxtmaximal
Dosimetry screen
Dosimetry measurements
Dosimetry View
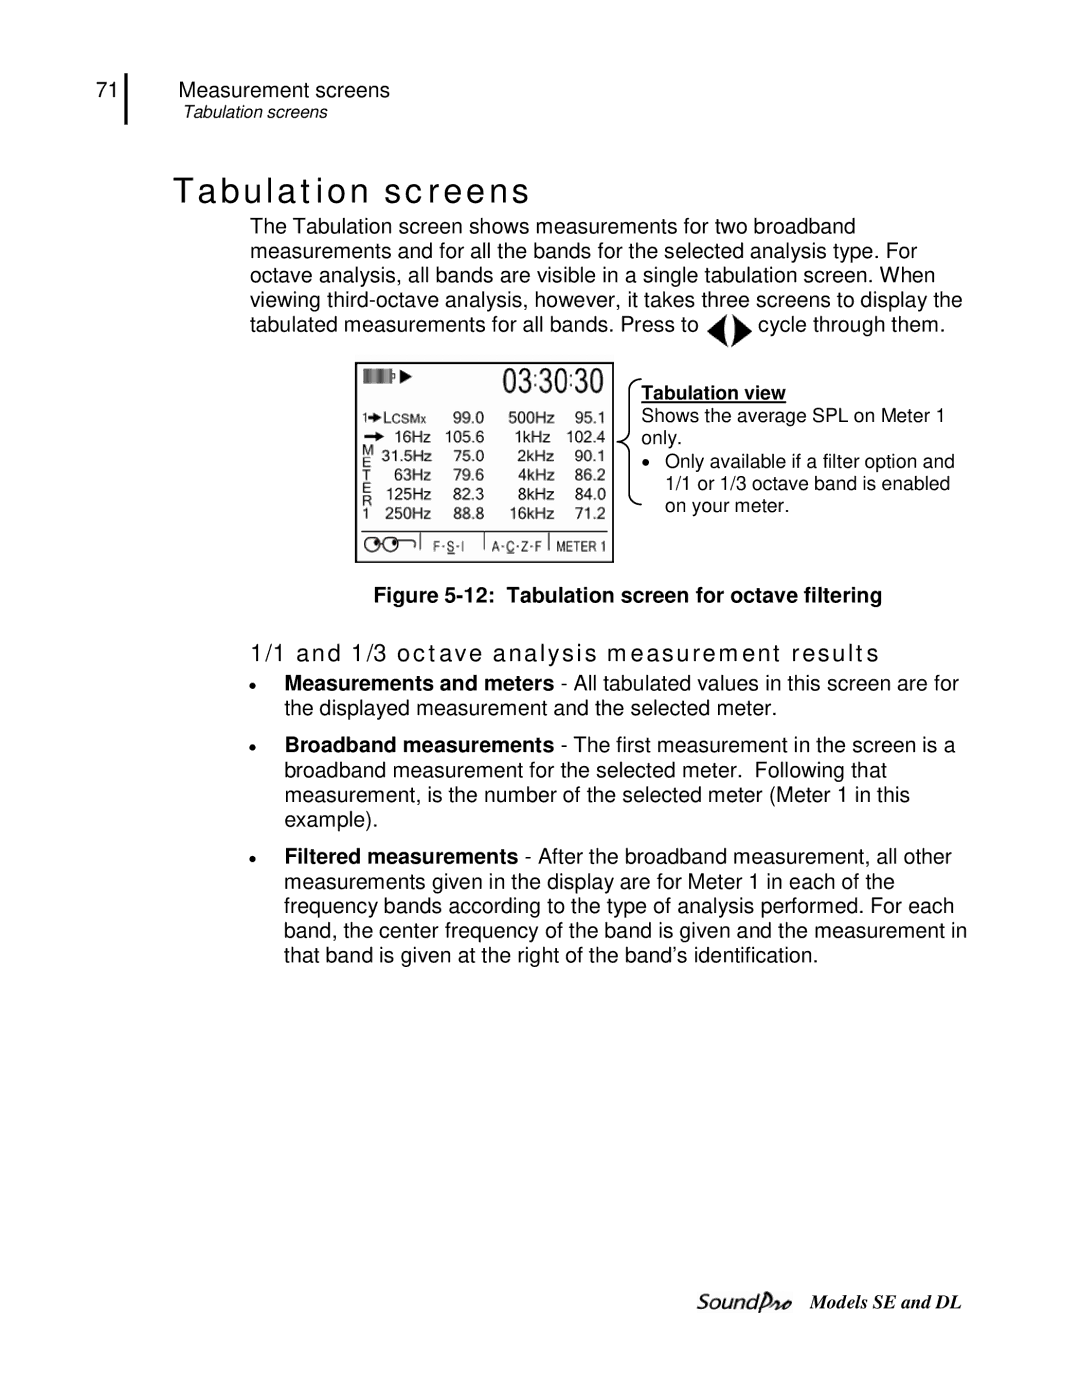
12 Tabulation screen for octave filtering
Tabulation view
Back-erasing
13 Back-erasing
How to back-erase
Results of back-erasing
14 Time Log screen
Stopping and pausing
Stopping a session
This page left blank intentionally
RT60, Curves, and STI-PA
Additional options
Reverberation time RT60
Reverberation RT60 methods
DB level Decay Curve
DB level2
Interrupted noise
Impulse noise
Reverberation options
Reverberation time set-up options
Setting up reverberation
Reverb Time options
Running reverberation test
Reverberation RT60 Test
Reverberation results
Measurement type
RT60 bar chart
RT60 summary screen
Viewing RT60 values of each band
Deleting RT60 value in a filtered band
Decay curve screen
Viewing decay value of each band
Tabular RT60 screen
Txx
Tabular RT60 field explanation
Viewing Tabulation RT60 screen
Curves
Captured curves
Captured curve applications
Setting up captured curves
Selecting measurement type for curves
Curves screen Mode
Type
Running captured curves
10 Selecting 1/1 or 1/3 for measurement type
Criterion curve families
Types of Criterion Curves
Capture Press Capture softkey to Capture a curve
Setting up criterion curves
12 Selecting measurement type for curves
13 Curves setup screen example
Setting up audiometric background curves
Audiometric background curves
Press On/Off/Esc
Curves screen
Running and viewing curves
Curve measurements and results
Running a curve study and viewing results
Sample bar chart with curves Tabulation screen
Dosimetry screen Delta screen
STI-PA testing
Speech Intelligibility
Zones
Selecting STI scale or CIS scale
When to take STI-PA readings?
STI scale
Common Intelligibility Scale CIS
STI-PA setup
Measures Explanation Setup screen
Conducting a STI-PA test overview of steps
Field
Range field
Selecting measurement type
Post Process
To select a Captured Curve or
Off
Speech Intelligibility screen
Captured Curve selection
Conducting a level setup for STI-PA
How to run a STI-PA study?
Average dB level Displayed while in run or pause mode
Running a speech intelligibility study
STI-PA results screens
STI-PA measurement and scale results screen
Viewing STI-PA results
STI-PA results
STI-PA modulation screen
22 STI-PA Modulation screen
Storing background noise/capture curve
STI-PA modulation envelope screen
Scale
Mode
Captured CAP
Applying captured curves for STI-PA testing
Applying captured curves
STI-PA test results screen
This page left blank intentionally
Files
File directories
Viewing past sessions/studies review mode
File directory screen explained
Session Directory
Start menu screen
File menu screen
Session or View Current Study by pressing
Data file
Run time
Loading or deleting a file
Loading and deleting files
Examples of directory screens
Navigating in a session/config. directory
Naming and renaming files
Renaming the session in memory
Configuration directory
Saving & naming setup file config. file
Naming and Saving set-up
Save
Viewing, loading, deleting setup files config
Viewing, loading, deleting setup files
Delete softkey Load softkey
Memory card
Compatibility
Formatting a card with the SoundPro
Determining the format of an SD card
Using Detection Management Software DMS
Using an external card reader
Eject procedure
Communicating with a PC
DMS and working with SoundPro data
Viewing data and Data Finder
AC/DC output
AC output
DC output
AC output
This page left blank intentionally
Mechanical characteristics
Conformance to standards
Acoustics
EMC emissions and immunity
Electrical characteristics
Power sources
Preamplifier removable
Meters
Bandwidth
Temperature
Environmental effects
Octave filters optional
Third-octave filters optional
User interface
Input/output
Characteristic BK4936 QE7052 QE4110 QE4130 QE4150 QE4170
AC/DC outputs
Measurements
Communications ports
Types
Ranges
Special features
Calibration
Studies and sessions
Other
Replacement parts
Logging optional
Part numbers
Back-erase
Optional parts
Auxiliary connector
Port pinouts
AC/DC jack
Block Diagram for SoundPro
Center frequency
Criterion Level
137 Appendix B
Dose
Dynamic range
ExpHrs
ExpSec
Appendix B Exceedance Level Ln
Exchange Rate ER
Level LFT
Lavg = ER log20RTIME 2LS ⁄ ER dt log2 Rtime dB
LMn
LMx
Logging
LPk
NCB Balanced Noise Criterion Curves
Noise Criterion Curves NC
Noise Rating Curves NR
Noise Floor
Peak -C
Level Range dB Peak C Level Range dB
Response time F,S
Relative response dB Burst duration, t seconds
Relative response dB Burst duration, t milliseconds
Room Criterion Curves RC
SEL
Taktmx
Third-octave band
Threshold
Upper Limit UL
Weighting A, C, Z, F
Figure B-5All frequency weightings plotted together
148
Customer service
Service Department and Technical Support 1 800
Contacting 3M Instrumentation
International customers
Warranty
Appendix D
Index
152
SEL
SPL
About 3M Personal Safety
About Us