Fast EtherHub 3500 System User’s Guide
Screen statistics are not automatically refreshed from the agent. Select Refresh Statistics to update the displayed values.
The values displayed have been accumulated since the last system reboot or counter reset.
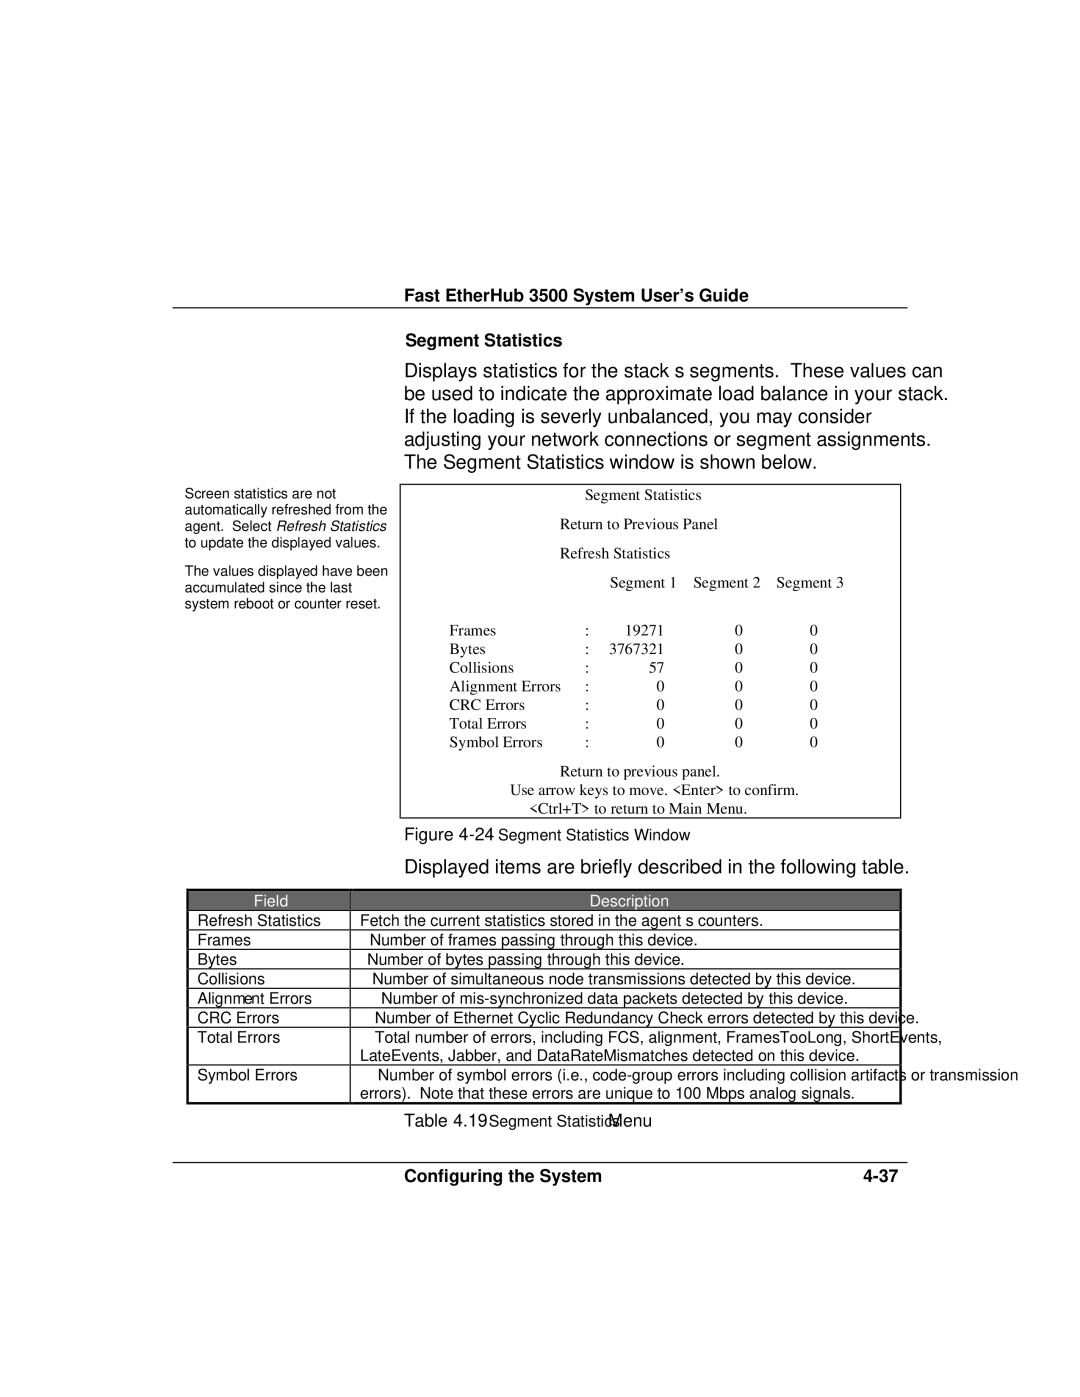
Segment Statistics
Displays statistics for the stack’s segments. These values can be used to indicate the approximate load balance in your stack. If the loading is severly unbalanced, you may consider adjusting your network connections or segment assignments. The Segment Statistics window is shown below.
| Segment Statistics |
| ||
Return to Previous Panel |
| |||
Refresh Statistics |
|
| ||
|
| Segment 1 | Segment 2 | Segment 3 |
Frames | : | 19271 | 0 | 0 |
Bytes | : | 3767321 | 0 | 0 |
Collisions | : | 57 | 0 | 0 |
Alignment Errors | : | 0 | 0 | 0 |
CRC Errors | : | 0 | 0 | 0 |
Total Errors | : | 0 | 0 | 0 |
Symbol Errors | : | 0 | 0 | 0 |
Return to previous panel.
Use arrow keys to move. <Enter> to confirm. <Ctrl+T> to return to Main Menu.
Figure 4-24 Segment Statistics Window
Field
Refresh Statistics
Frames
Bytes
Collisions
Alignment Errors
CRC Errors
Total Errors
Symbol Errors
Displayed items are briefly described in the following table.
Description
Fetch the current statistics stored in the agent’s counters.
Number of frames passing through this device.
Number of bytes passing through this device.
Number of simultaneous node transmissions detected by this device.
Number of
Number of Ethernet Cyclic Redundancy Check errors detected by this device.
Total number of errors, including FCS, alignment, FramesTooLong, ShortEvents, LateEvents, Jabber, and DataRateMismatches detected on this device.
Number of symbol errors (i.e.,
Table 4.19 Segment Statistics Menu
Configuring the System |