Corporate Headquarters
Customer Order Number Text Part Number OL-4211-03
Copyright 2005 Cisco Systems, Inc All rights reserved
N T E N T S
Iii
Assembling the Antenna
Overview
Pop-Up Menu Help Exit
Select Profile
Vii
Antenna Installation Warning B-3
Viii
WPA
OL-4211-03
Preface
Following topics are covered in this section
Audience
Purpose
Organization
Xii
Conventions
Xiii
Xiv
Related Publications
Obtaining Documentation
Cisco.com
Documentation DVD
Cisco Product Security Overview
Ordering Documentation
Documentation Feedback
Xvi
Reporting Security Problems in Cisco Products
Obtaining Technical Assistance
Cisco Technical Support Website
An emergency, you can also reach Psirt by telephone 877 408
Submitting a Service Request
Definitions of Service Request Severity
Xviii
Obtaining Additional Publications and Information
Xix
OL-4211-03
Product Overview
Introduction to the Client Adapters
Terminology
Client Adapter Model Number Description
AIR-CB21AG
Hardware Components
Radio
Radio Antenna
LEDs
Software Components
Driver
Client Utilities
Network Configurations Using Client Adapters
Ad Hoc Wireless LAN
Access Point Root Unit Wired LAN
Preparing for Installation
Safety information
FCC Safety Compliance Statement
Safety Guidelines
Package Contents
Unpacking the Client Adapter
System Requirements
Site Requirements
For Infrastructure Devices
For Client Devices
OL-4211-03
Installing the Client Adapter
Inserting a Client Adapter
Inserting a PC-Cardbus Card
Inserting a PCI Card
Changing the Bracket
Bracket screws
Inserting the Card
Assembling the Antenna
Inserting a PCI Card into a PC
Mounting the Antenna
Inserting the Antenna into Its Base
Bottom of Antenna Base
Mounting the Antenna
Installing the Client Adapter Software
Preparing Setup Window
Click Next. The Setup Type window appears see Figure
Cisco Aironet Installation Program Window
10 Setup Type Window
11 Install Cisco Aironet Site Survey Utility Window
12 Choose Destination Location Window
13 Select Program Folder Window
14 Important Please Read! Window
Feature
15 Choose Configuration Tool Window
Leap or EAP-FAST authentication
With dynamic WEP EAP-TLS or Peap authentication Yes
Security Static WEP Yes
Receive
Click Properties
Installing a Microsoft Hot Fix for Group Policy Delay
Page
OL-4211-03
Using the Profile Manager
Overview of Profile Manager
Opening Profile Manager
Field Description
SSID1
SSID2
SSID3
Creating a New Profile
Available Infrastructure and Ad Hoc Networks Window
SNR
Profile Management General Window
Including a Profile in Auto Profile Selection
Auto Profile Selection Management Window
OL-4211-03
Selecting the Active Profile
Modifying a Profile
Importing and Exporting Profiles
Editing a Profile
Deleting a Profile
Importing a Profile
Exporting a Profile
Export Profile Window
Configuring the Client Adapter
Overview
Parameter Category Number
Setting General Parameters
Parameter Description
Reconfigured
Auto profile selection or configured for use in an ad hoc
Client adapter to roam to that network without having to be
Auto profile selection
Setting Advanced Parameters
Profile Management Advanced Window
Radio Band Transmit Power Level
Profile Management Advanced Parameters
Network Type Description
Parameter Description
Parameter Description
Default Open
Setting Security Parameters
Preferred Access Points Window
Overview of Security Features
Profile Management Security Window
Static WEP Keys
EAP with Dynamic WEP Keys
Configuring the Client Adapter Setting Security Parameters
LEAP,
EAP-FAST, EAP-TLS, Peap EAP-GTC, or Peap EAP-MSCHAP V2,
WPA and WPA2
Cckm Fast Secure Roaming
Reporting Access Points that Fail Leap Authentication
Synchronizing Security Features
Additional WEP Key Security Features
Security Feature Client Setting Access Point Setting
Ssid
WPA
Security Feature Client Setting Access Point Setting
LEAP, EAP-FAST, EAP-TLS
Or later, choose a cipher suite that is
WPA/WPA2/CCKM
MIC
Enabling Static WEP
Tkip
Peap EAP-MSCHAP
Interval to any value other than
Configuring the Client Adapter Setting Security Parameters
Enabling WPA/WPA2 Passphrase
Define WPA/WPA2 Pre-Shared Key Window
Enabling Leap
Leap Settings Window
Configuring the Client Adapter Setting Security Parameters
Configuring the Client Adapter Setting Security Parameters
Enabling EAP-FAST
EAP-FAST Settings Window
Configuring the Client Adapter Setting Security Parameters
Click Select More
Select EAP-FAST PAC Window
10 Import EAP-FAST PAC File Window
Configuring the Client Adapter Setting Security Parameters
Deleting a Manually Provisioned PAC File
Enabling EAP-TLS or Peap
Enabling EAP-TLS
12 Define Certificate Window
Configuring the Client Adapter Setting Security Parameters
Enabling Peap EAP-GTC
13 Define Peap EAP-GTC Configuration Window
14 Configuration Settings Window
Configuring the Client Adapter Setting Security Parameters
15 Define Peap EAP-MSCHAP V2 Configuration Window
Enabling Peap EAP-MSCHAP
16 Configuration Settings Window
Configuring the Client Adapter Setting Security Parameters
Configuring the Client Adapter Setting Security Parameters
Configuring the Client Adapter Setting Security Parameters
Enabling Wi-Fi Multimedia
Disabling Static WEP, WPA/WPA2 Passphrase, or EAP
Enabling the QoS Packet Scheduler on Windows
17 Wireless Cisco Connection Properties Window
18 Select Network Component Type Window
Enabling the QoS Packet Scheduler on Windows XP
Click Control Panel Double-clickNetwork Connections
Setting Roaming Parameters in the Windows Control Panel
Follow these steps to access the roaming parameters
Wireless Mode
Using EAP Authentication
Using Leap or EAP-FAST
Leap or EAP-FAST Authentication Status Window
After Profile Activation or Card Insertion
Stage Explanation
After a Reboot or Logon
After Your EAP-FAST Password Expires
Using Leap or EAP-FAST with an Automatically Prompted Login
Enter Wireless Network Password Window
After Your EAP-FAST Password Expires
Using Leap or EAP-FAST with a Manually Prompted Login
After Profile Activation
After a Reboot, Logon, or Card Insertion
Action Drop-Down Menu
After Your EAP-FAST Password Expires
Using Leap or EAP-FAST with a Saved Username and Password
Using EAP-TLS
10 Please Change Password Window
Using Peap EAP-GTC
Windows NT or 2000 Domain Databases or Ldap Databases Only
OTP Databases Only
Using Peap EAP-MSCHAP
Restarting the Authentication Process
OL-4211-03
Viewing Status and Statistics
Overview of ADU Status and Statistics Tools
Tool
Status Statistics
Number
Displays the signal strength
Signal-to-noise ratio as a percentage
Viewing the Current Status of Your Client Adapter
3interprets each element of the Current Status window
Status Description
Status Description
Details on these server-based authentication types
4interprets each element of the Advanced Status window
None MIC is disabled
MIC is enabled and is being used with
Michael MIC is enabled and is being used with WPA and Tkip
MMH
WMM
Status Description
Status Description
Cisco Aironet Desktop Utility Diagnostics Window
Viewing Statistics for Your Client Adapter
Statistic Description
Advanced Statistics Window
6interprets each element of the Advanced Statistics window
Integrity check MIC value when Ckip was being used
Ckip MIC OK
Point
OL-4211-03
Using the Aironet System Tray Utility Astu
Infrastructure mode or another client in ad hoc mode
Overview of Astu
Astu Icon
Icon Description
Tool Tip Window
Status Element Description
Connection Status Description
This option enables you to access the online help
Pop-Up Menu
Help
Following sections describe each Astu pop-up menu option
Troubleshooting
Exit
Open Aironet Desktop Utility
Preferences
Enable/Disable Radio
Manual Login
Reauthenticate
Select Profile
Show Connection Status
Connection Status Window
Connection Status Window Elements
Ssid
OL-4211-03
Routine Procedures
Removing a Client Adapter
Removing a PC-Cardbus Card
Removing a PCI Card
Client Adapter Software Procedures
Upgrading the Client Adapter Software
Previous Installation Detected Window
Choose Update the previous installation and click Next
Uninstalling the Client Adapter Software
Choose Uninstall the previous installation and click Next
ADU Procedures
Opening ADU
Exiting ADU
Finding the Version of ADU
Viewing Client Adapter Information
Astu Procedures
Accessing Online Help
Refer to for instructions on using Astu
Enabling or Disabling Your Client Adapter’s Radio
OL-4211-03
Troubleshooting
10-1
Accessing the Latest Troubleshooting Information
Interpreting the Indicator LEDs
Status LED green Activity LED amber Condition
10-2
Troubleshooting the Client Adapter
Using the Troubleshooting Utility
Troubleshooting Information Number
Diagnosing Your Client Adapter’s Operation
Troubleshooting Utility Window
10-4
Troubleshooting Utility Window with Test Results
10-5
Troubleshooting Utility Window Detailed Report
10-6
Saving the Detailed Report to a Text File
10-7
Client Adapter Recognition Problems
Disabling the Microsoft 802.1X Supplicant Windows 2000 Only
10-8
Reboot your computer
Resolving Resource Conflicts
Resolving Resource Conflicts in Windows
10-9
Problems Associating to an Access Point
Resolving Resource Conflicts in Windows XP
10-10
Problems Connecting to the Network
Prioritizing Network Connections
Parameters Missing from Profile Management Windows
10-11
Error Messages
10-12
10-13
10-14
10-15
10-16
10-17
10-18
10-19
10-20
10-21
10-22
10-23
10-24
Technical Specifications
Physical Specifications
Radio Specifications
ESD
KV human body model
Appendix a Technical Specifications
Receiver sensitivity 802.11a
DBm @ 6, 9, 12, and 18 Mbps
DBm @ 24 Mbps
DBm @ 36 Mbps
Indoor typical Outdoor typical
Power Specifications
Safety and Regulatory Compliance Specifications
Translated Safety Warnings
Explosive Device Proximity Warning
Antenna Installation Warning
Appendix B Translated Safety Warnings
Appendix B Translated Safety Warnings
Appendix B Translated Safety Warnings
Declarations of Conformity and Regulatory Information
Models AIR-CB21AG-A-K9, AIR-PI21AG-A-K9
USA
Department of Communications Canada
Canadian Compliance Statement
OL-4211-03
Cisco Aironet CB21AG Wireless LAN Client Adapter
Declaration of Conformity Statement
Cisco Aironet PI21AG Wireless LAN Client Adapter
Declaration of Conformity for RF Exposure
Japanese Translation
English Translation
5-GHz Client Adapters
Chinese Translation
English Translation
Communication ACT
GHz Client Adapters
This equipment is limited for indoor use
OL-4211-03
Channels, Power Levels, and Antenna Gains
Channels
Ieee 802.11a
Regulatory Domains
Ieee 802.11b/g
Maximum Power Levels and Antenna Gains
Ieee 802.11b
Data Rate
With 1-dBi Antenna Gain
Ieee 802.11g
Mbps 31.6
OL-4211-03
P E N D I X E
Overview
EAP with Dynamic WEP Keys
WPA
Configuring the Client Adapter
Configuring the Client Adapter
Page
Configuring the Client Adapter
Page
Enabling EAP-TLS Authentication
For EAP type, choose Smart Card or other Certificate
Configuring the Client Adapter
Enabling Peap Authentication
Figure E-6 Protected EAP Properties Window
Figure E-7 EAP MSCHAPv2 Properties Window
Figure E-8 Peap Properties Window
Figure E-9 Generic Token Card Properties Window
Associating to an Access Point Using Windows XP
Figure E-10 Wireless Network Connection Status Window
Performing a Site Survey
Guidelines
Additional Information
Opening the Site Survey Utility
Selecting the Client Adapter
Using the Associated AP Status Tab
Specifying Display Units
Viewing the Access Point’s Status
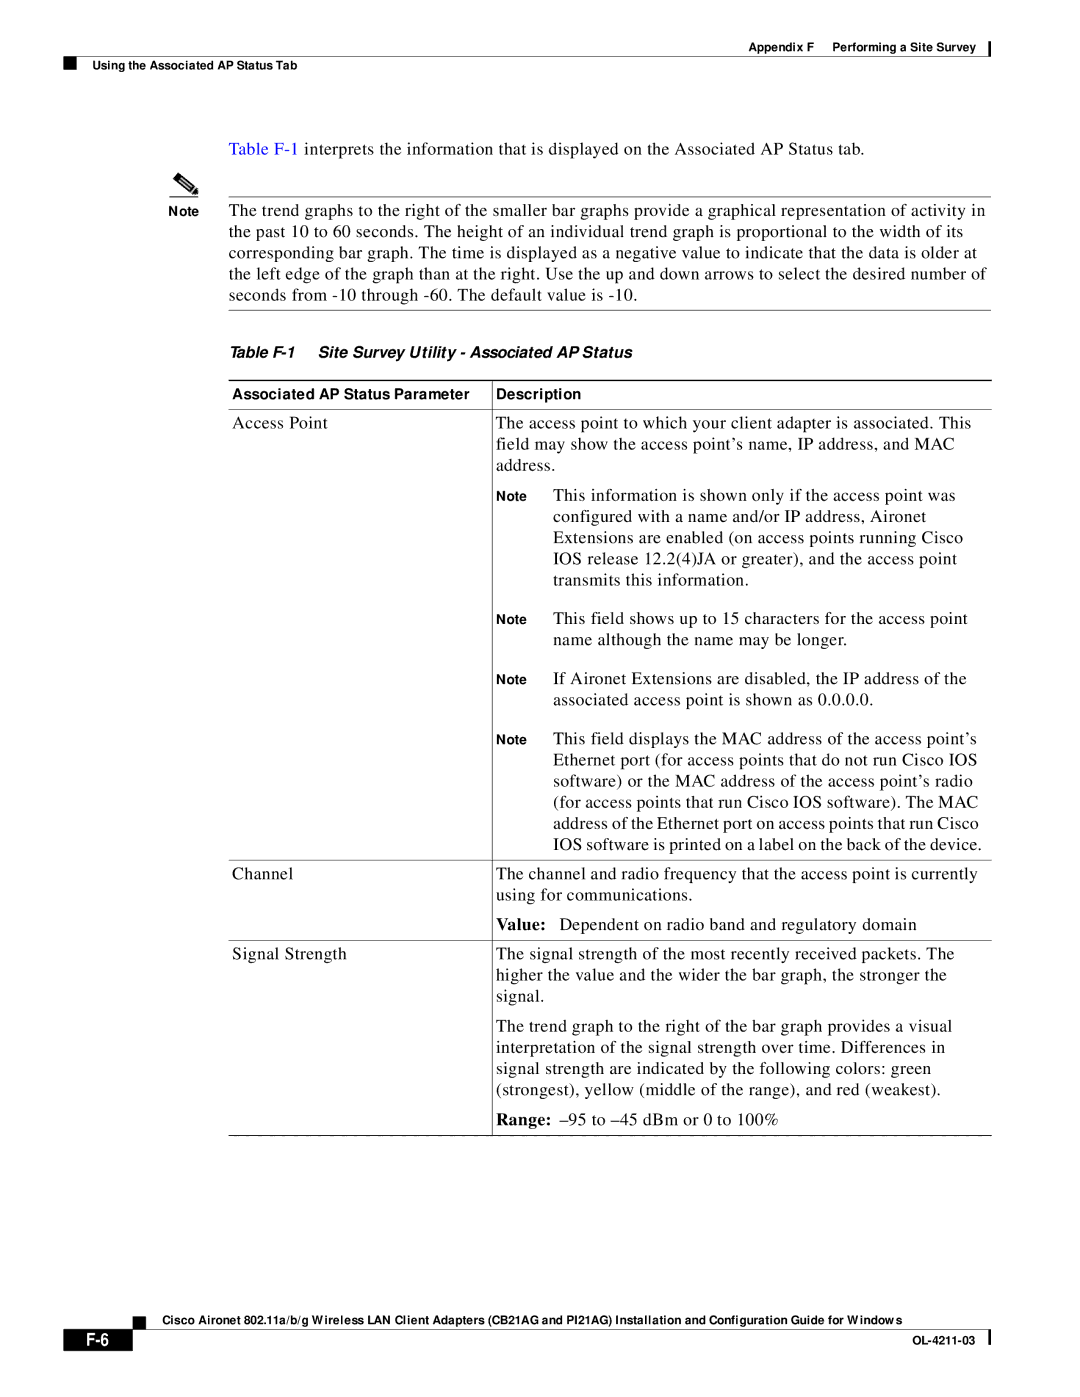
Table F-1 Site Survey Utility Associated AP Status
Description
Using the AP Scan List Tab
Viewing the AP Scan List
Figure F-5 Site Survey Utility AP Scan List
Rssi
Pausing the AP Scan List
CCX
Value 1, 2, 3, or
Access point’s wireless network
Viewing AP Details
Detailed Information Parameter Description
Rssi
Generating an AP Scan Log File
Figure F-7 Site Survey Utility Log File
Accessing Online Help
Uninstalling the Site Survey Utility
Finding the Version of the Site Survey Utility
Exiting the Site Survey Utility
Page
Wireless network composed of stations without access points
Stations
Standard
Set of characters that contains both letters and numbers
GL-2
Setting must be within the range of 64 to 2312 bytes
GL-3
Ethernet 802.3 and wireless LAN 802.11 specifications
GL-4
GL-5
GL-6
Computing device with an installed client adapter
Protection and 802.1X for authenticated key management
802.1X for authenticated key management
GL-7
GL-8
Authentication Mode parameter
Selecting in ADU
IN-1
Pausing Viewing
ADU
Selecting the active profile
IN-2
Astu
CAM
IN-3
ADU Windows XP
Data encryption ADU Site survey utility
FCC C-2
IN-4
IN-5
CRC
FCC
ACK CTS
RTS
IN-7
Disabling Enabling
MMH MIC
Status With Leap Modify button
IN-8
IN-9
IN-10
IN-11
IN-12
Regulatory compliance Safety Spread spectrum
Setting Viewing ADU
IN-13
Third-party tool, enabling in Install Wizard
Initial window
With test results
IN-14
Security features
IN-15
IN-16