Reports
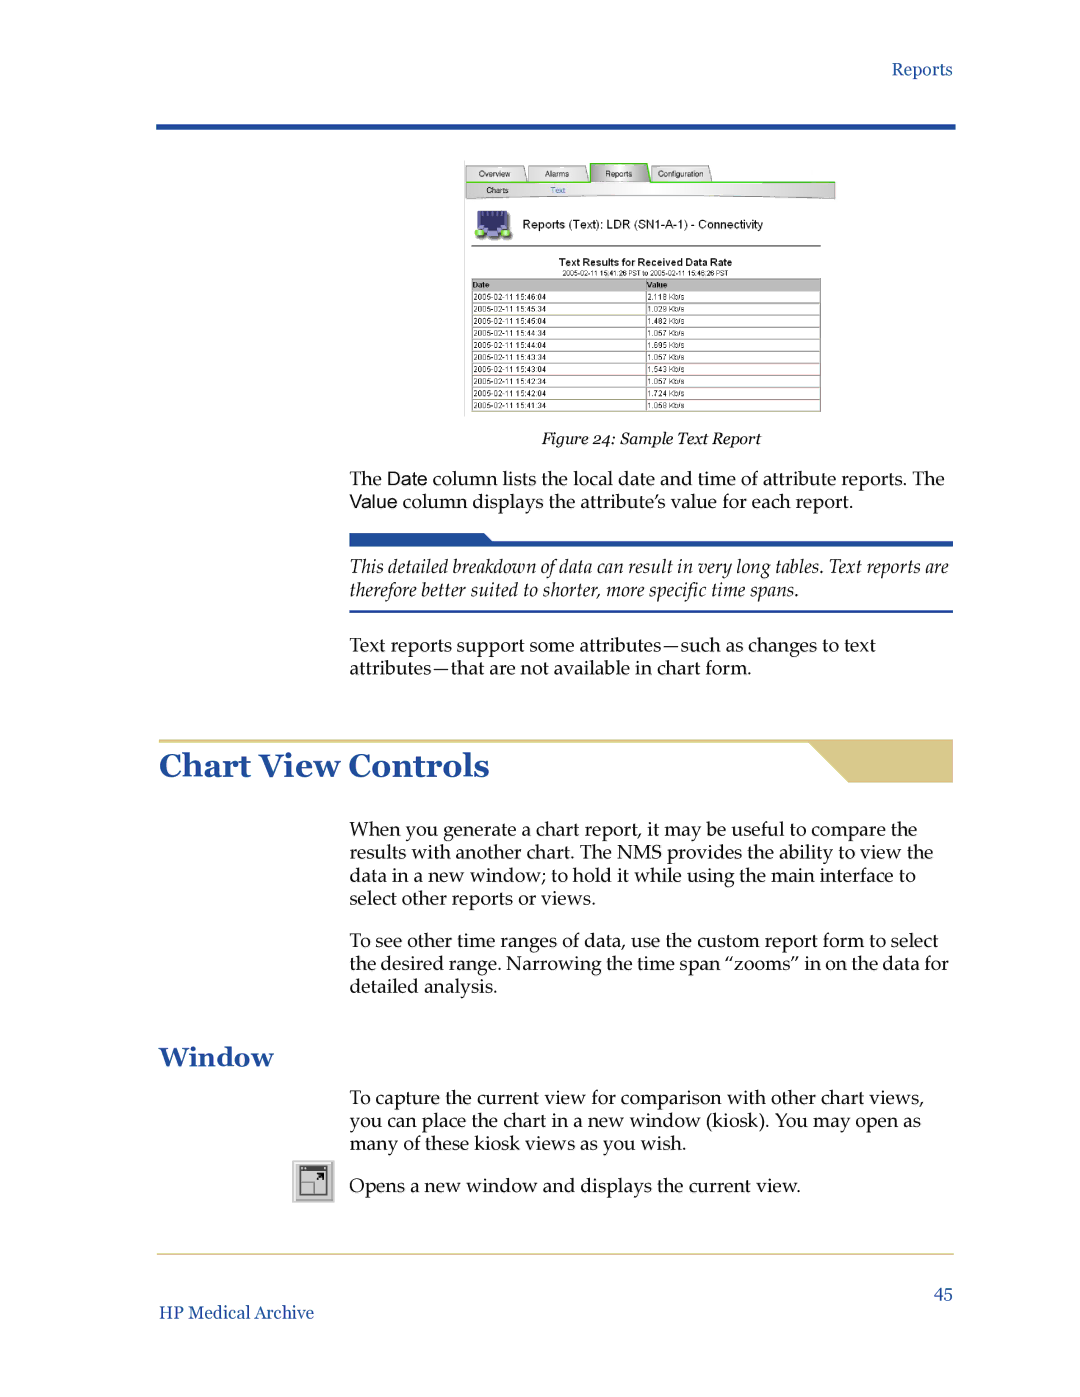
Figure 24: Sample Text Report
The Date column lists the local date and time of attribute reports. The
Value column displays the attribute’s value for each report.
This detailed breakdown of data can result in very long tables. Text reports are therefore better suited to shorter, more specific time spans.
Text reports support some
Chart View Controls
When you generate a chart report, it may be useful to compare the results with another chart. The NMS provides the ability to view the data in a new window; to hold it while using the main interface to select other reports or views.
To see other time ranges of data, use the custom report form to select the desired range. Narrowing the time span “zooms” in on the data for detailed analysis.
Window
To capture the current view for comparison with other chart views, you can place the chart in a new window (kiosk). You may open as many of these kiosk views as you wish.
Opens a new window and displays the current view.
45
HP Medical Archive