HPMA User Guide
System Status Overview
The Network Management System provides useful
The NMS uses
locations and levels. When you first view the NMS interface, the System Status icon (in the upper right corner of the page) indicates the
highest alarm level on the system. You can then use the NMS tree or maps to locate the specific grid problem, assess the cause, and take quick action toward a resolution.
System Monitoring
A primary role of the NMS is to monitor grid activity and issue alarms if any attributes reach or exceed
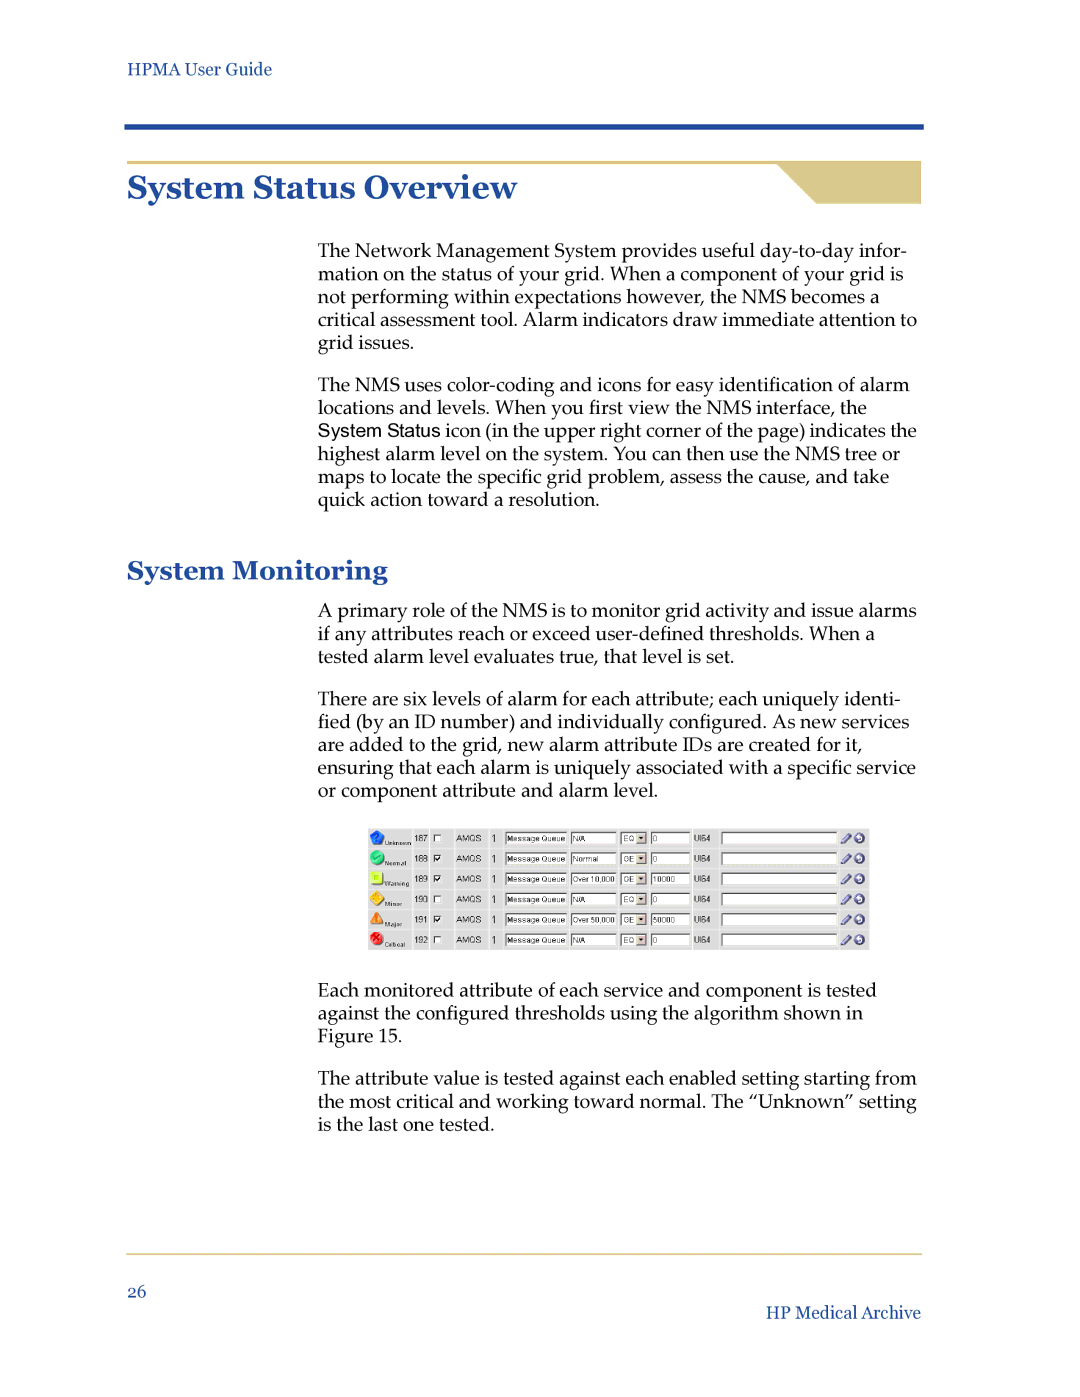
There are six levels of alarm for each attribute; each uniquely identi- fied (by an ID number) and individually configured. As new services are added to the grid, new alarm attribute IDs are created for it, ensuring that each alarm is uniquely associated with a specific service or component attribute and alarm level.
Each monitored attribute of each service and component is tested against the configured thresholds using the algorithm shown in Figure 15.
The attribute value is tested against each enabled setting starting from the most critical and working toward normal. The “Unknown” setting is the last one tested.
26
HP Medical Archive