Services and Components
Events
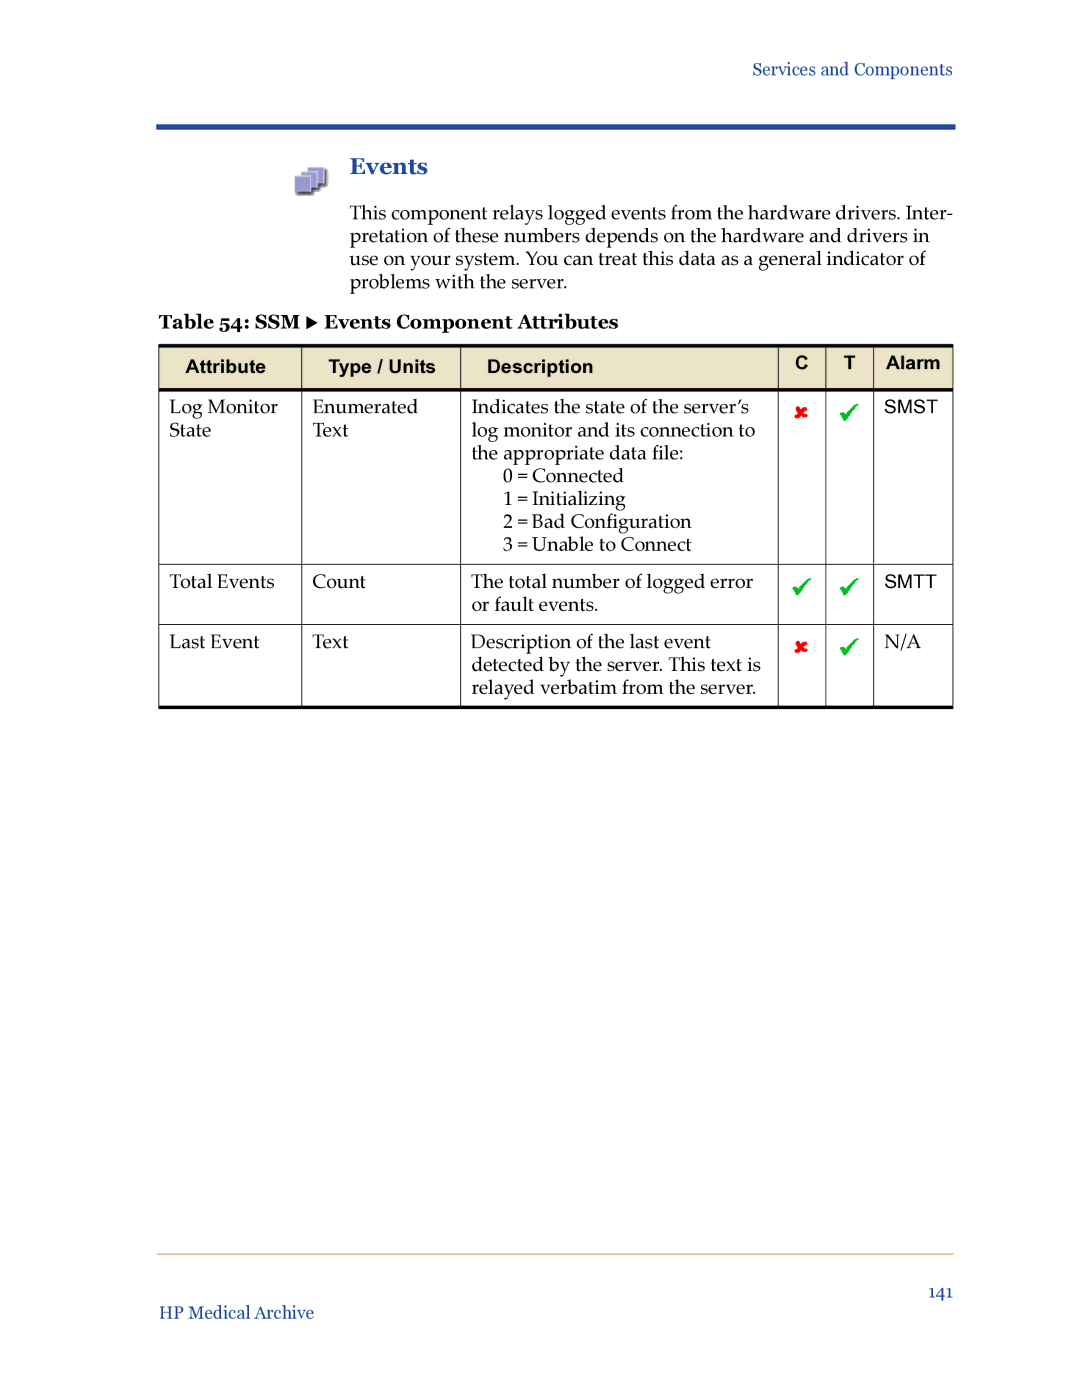
This component relays logged events from the hardware drivers. Inter- pretation of these numbers depends on the hardware and drivers in use on your system. You can treat this data as a general indicator of problems with the server.
Table 54: SSM X Events Component Attributes
Attribute | Type / Units | Description | C | T | Alarm | |
|
|
|
|
|
| |
Log Monitor | Enumerated | Indicates the state of the server’s |
|
| SMST | |
State | Text | log monitor and its connection to |
|
|
| |
|
| the appropriate data file: |
|
|
| |
|
| 0 | = Connected |
|
|
|
|
| 1 | = Initializing |
|
|
|
|
| 2 | = Bad Configuration |
|
|
|
|
| 3 | = Unable to Connect |
|
|
|
|
|
|
|
|
| |
Total Events | Count | The total number of logged error |
|
| SMTT | |
|
| or fault events. |
|
|
| |
|
|
|
|
|
| |
Last Event | Text | Description of the last event |
|
| N/A | |
|
| detected by the server. This text is |
|
|
| |
|
| relayed verbatim from the server. |
|
|
| |
|
|
|
|
|
|
|
141
HP Medical Archive