Alarms
Each row provides detailed information about the alarm (see Table 4 on page 31 for details). More detailed information about each attribute’s code, value, and definition can be found in Chapter 7, “Troubleshooting Alarms” on page 171.
Once the alarm is resolved, the alarm returns to the green status to indicate that the attribute has returned to a normal state.
You can access and view alarm status at both the service and the com- ponent levels. There are two pages under the Alarms tab: Main and History. When the tab is selected, it defaults to the Main page, which
provides details of the current status.
Main Page
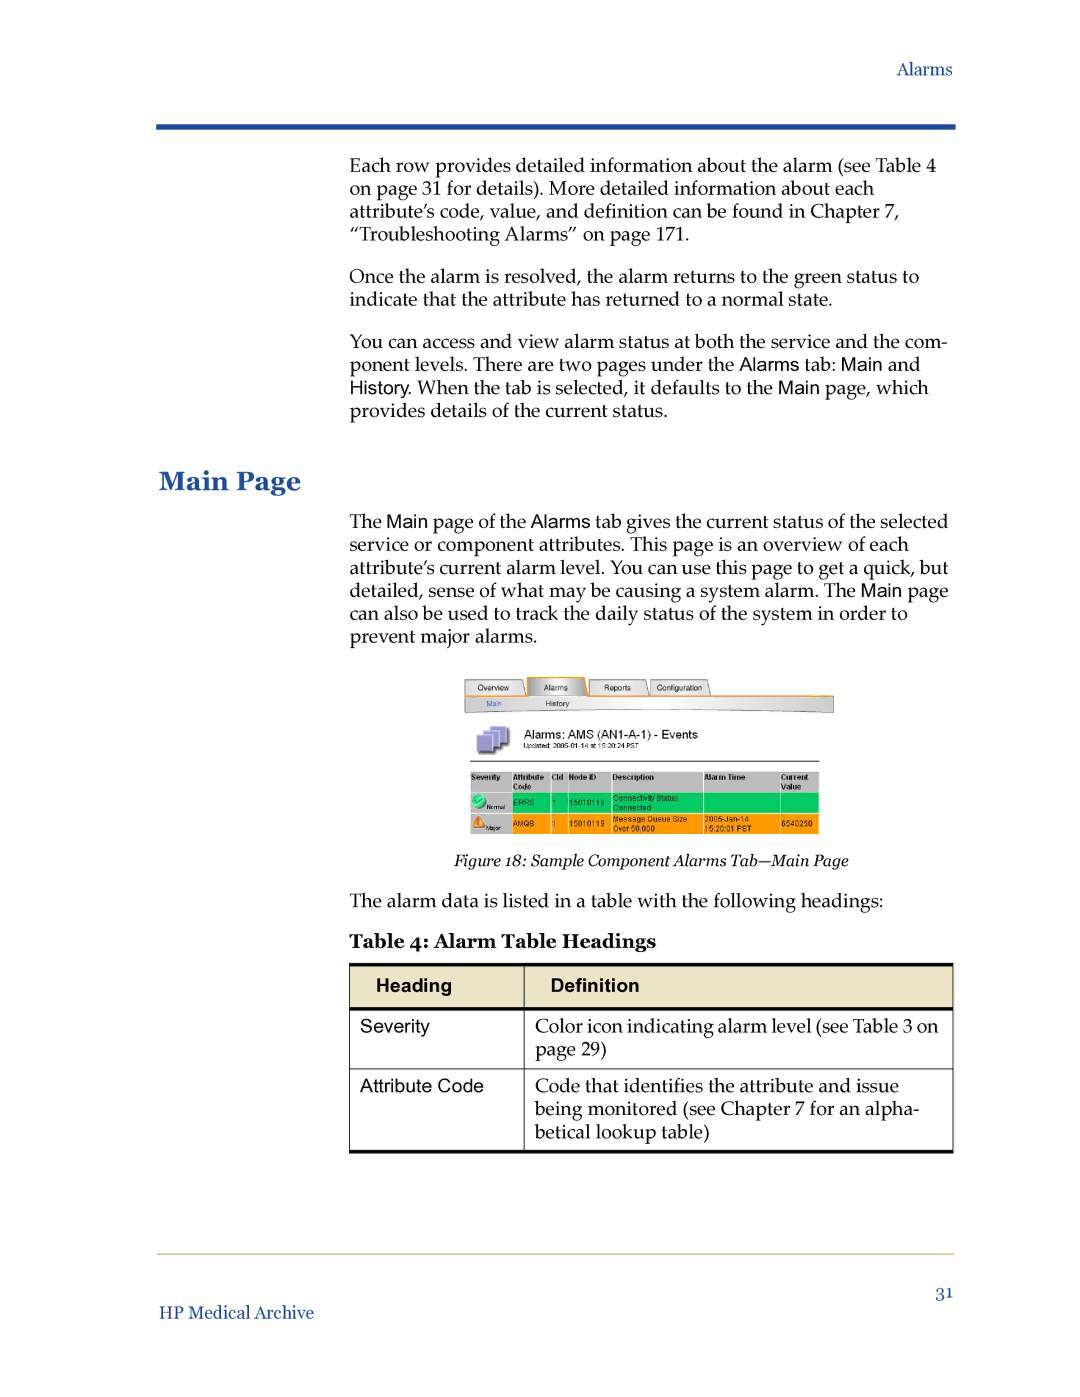
The Main page of the Alarms tab gives the current status of the selected service or component attributes. This page is an overview of each attribute’s current alarm level. You can use this page to get a quick, but detailed, sense of what may be causing a system alarm. The Main page can also be used to track the daily status of the system in order to prevent major alarms.
Figure 18: Sample Component Alarms Tab—Main Page
The alarm data is listed in a table with the following headings:
Table 4: Alarm Table Headings
Heading | Definition |
|
|
Severity | Color icon indicating alarm level (see Table 3 on |
| page 29) |
|
|
Attribute Code | Code that identifies the attribute and issue |
| being monitored (see Chapter 7 for an alpha- |
| betical lookup table) |
|
|
31
HP Medical Archive