Hp LaserJet family Quick reference Service guide
Page
HP LaserJet Family Quick Reference Service Guide
Warranty
Contents
Ordering other manuals
LJ 4100DTN
Supported products
Supported products
Control-panel messages
Chapter contents
Overview of printer messages
Control-panel lights legend
Light symbol Meaning of symbol
Control-panel light messages
Message Possible causes Solutions
Correct input tray
Fatal error secondary messages
Fatal error secondary messages
Message Cause Solution
ECU
Reconnect the I/O cable
Light states
LaserJet 2200 Series printer control-panel light messages
Primary status codes
One or two pages
Continuable, fatal, and accessory errors
Continuable attention error codes
Control-panel light Continuable Action Pattern Message
Control-panel light Continuable Recommended Pattern Action
Continuable attention error secondary codes
Simplify the image or
Continuable attention error secondary codes
Turn the printer on
Continuable attention error secondary codes
Dimm
Fatal error codes
Control-panel light
Pattern Action
Control-panel light Fatal error Recommended Pattern
Fatal error secondary codes
Scan motor error Turn the power off Back on Status log code
Then turn it back
Status log code If the message
Accessory error codes
Accessory errors secondary codes
Accessory errors secondary codes
Alphabetical messages
Access denied/menus locked
Number is a group, group not allowed
Already in group
Bad opt tray connection
Bad env. feeder connection
Blacklisted France only
Busy
Cancel group edit, Enter to confirm
Canceled copy/Clear document feeder
Canceled fax/Clear document feeder
Cannot duplex/Close rear bin
Canceled scan/Clear document feeder
Checking paper path
Communication error
Clear document from scanner
Close top cover
Config. stuck addr
Configuration err # number
Config. tied addr
Copy count set to
Disk device failure
Decoding error # number
Disk file operation failed
Disk file system is full
EIO x initializing alternates with Do not power off
Duplex error, check duplexer
Documents were lost, Start to continue
EIO x not functional
EIO disk x non-functional
Encoding error
Env. feeder load TypeSize
Envelope feeder size =
Fatal system error
Errors likely in pages page range
Fax does not answer/Canceled send
Envelope feeder type
Fax memory full/Canceling receive
Fax memory error # number
Fax memory full/Canceling send
Fax does not answer/Redial pending
Fax send error
Fax receive error
Flash device failure
Flash file operation failed
Flash is write protected
Flash file system is full
Group dial not allowed in group
Group is full/FAX to start
Install duplexer
Cleaning mode/Please wait 1 3 min
Install toner cartridge
Input device condition xx.yy
Loading program number alternates with Do not power off
Install tray
Invalid date or time
Keypad test failed
Manually feed type size
Memory low/STOP to cancel
Memory full send unscanned pages
Memory full stored data lost
Modem error # number
Memory settings changed
Memory shortage job cleared
Memory shortage page simplified
No document sent
No dial tone
No fax detected
No fax in number tries
No fax pages in memory to reprint
No modem installed
No memory for report, erase/print document
No room in fax log
Non HP toner detected alternates with Press GO to continue
Not enough memory
Not enough memory to duplicate for copy
Output bin full alternates with Clear paper from bin name
Offline
Paper bin is empty, please add paper
Paper wrapped around fuser
Perform printer maintenance
Password must be 4 digits
Paused memory full
PC not detected/Address invalid
Polling-in error
Phone number error
Power fail recover/Checking system
Power fail recovery/Fax setting reset
Power off/Check Dimm #1-3
Power fail recover/Send fax number
Printer comm error
Printer comm error1
Printer laser error, call for service
Printer fixing error, replace fixing unit
Printer motor error, call for service
Printer is busy
Processing cleaning
Printer signal error
Printer tray mispick/ENTER to resume
Processing job
Receiving fax busy/Canceled fax
Receive error
RAM disk file operation failed
RAM disk file system is full
Receiving fax busy/Redial pending
Scan reference error
Redial failed
Remote fax was busy
Scanning error/Cannot connect to PC
Scanner error #1
Scanner isn’t available
Scanner jam reload
Speed dial number is not assigned
System error
Toner low
Toner out
Tray 1 load type size
Tray x load type size
Tray 1 size =
Tray 1 type =
Unable to mopy job
Unrecognized format
Unable to store job
Unsuccessful call
Unsupported size in tray yy
Wait for printer to reinitialize
Use type size instead?
Numerical messages
XX.YY printer error, press Go to continue
### group name one-touch/speed dial
### not programmed Enter to program
Paper jam open input trays
Paper jam check rear door Open and close top cover
Alternates with
Paper jam location
Door open jam
Insufficient memory alternates with Press Go to continue
Printer error alternates with Press Go to continue
Too complex alternates with Press Go to con- tinue
EIO x bad transmission alternates with Press Go to continue
Printer error
Unexpected paper size alternates with Load tray x type size
Reload the tray with the correct media size
Xx Printer error alternates with Cycle power to continue
= Description
Fuser error
Laser error
Cycle power to continue
Printer error alternates with Cycle power to continue
Printer error alternates with
Scanner error
Zz = Error number
53.xy.zz Printer memory error with an accessory
= Dimm type
= Device location
Remove sealing tape alternates with From toner cartridge
DC controller error
Xx Printer error alternates with Cycle power to continue
Turn the printer off, and then turn the printer on
Printer error Series only
Printer error alternates with Cycle power
= Location of problem
Nvram full check settings
Permanent storage error alternates with Check settings
Yy = Device-specific error
Permanent storage full
Service #### Series only
Service #### Series only
8x.yyyy EIO z error
Service ####
Service mode
110
Service mode overview
LJ 1200 Service mode functions
Initializing Nvram and using cold reset
To perform Nvram initialization
PJL software commands
Nvram PJL factory variables
Variable or command Possible settings
Recalibrating the copier/scanner
Nvram PJL factory variables
Entering Service mode
LJ 2200 Service mode functions
MS-DOS software Program entry What appears
Entering escape characters
Setting the page count
Setting the cold-reset default
Resetting the printer
Cold reset/EIO card reset
Nvram initialization
Control-panel Service menu
LJ 3100/3150 Service mode functions
Tests in control-panel Service mode
Control panel service menu
To gain access to the Extended Service menu
Extended Service menu
ADF motor test runs the document-scanner motor
Extended Service menu tree
Extended Service mode self-test failures
Self-test in Extended Service mode
Detect
Test If the test fails, take these actions
Other tests in Extended Service mode
Extended Service mode tests
Test Explanation
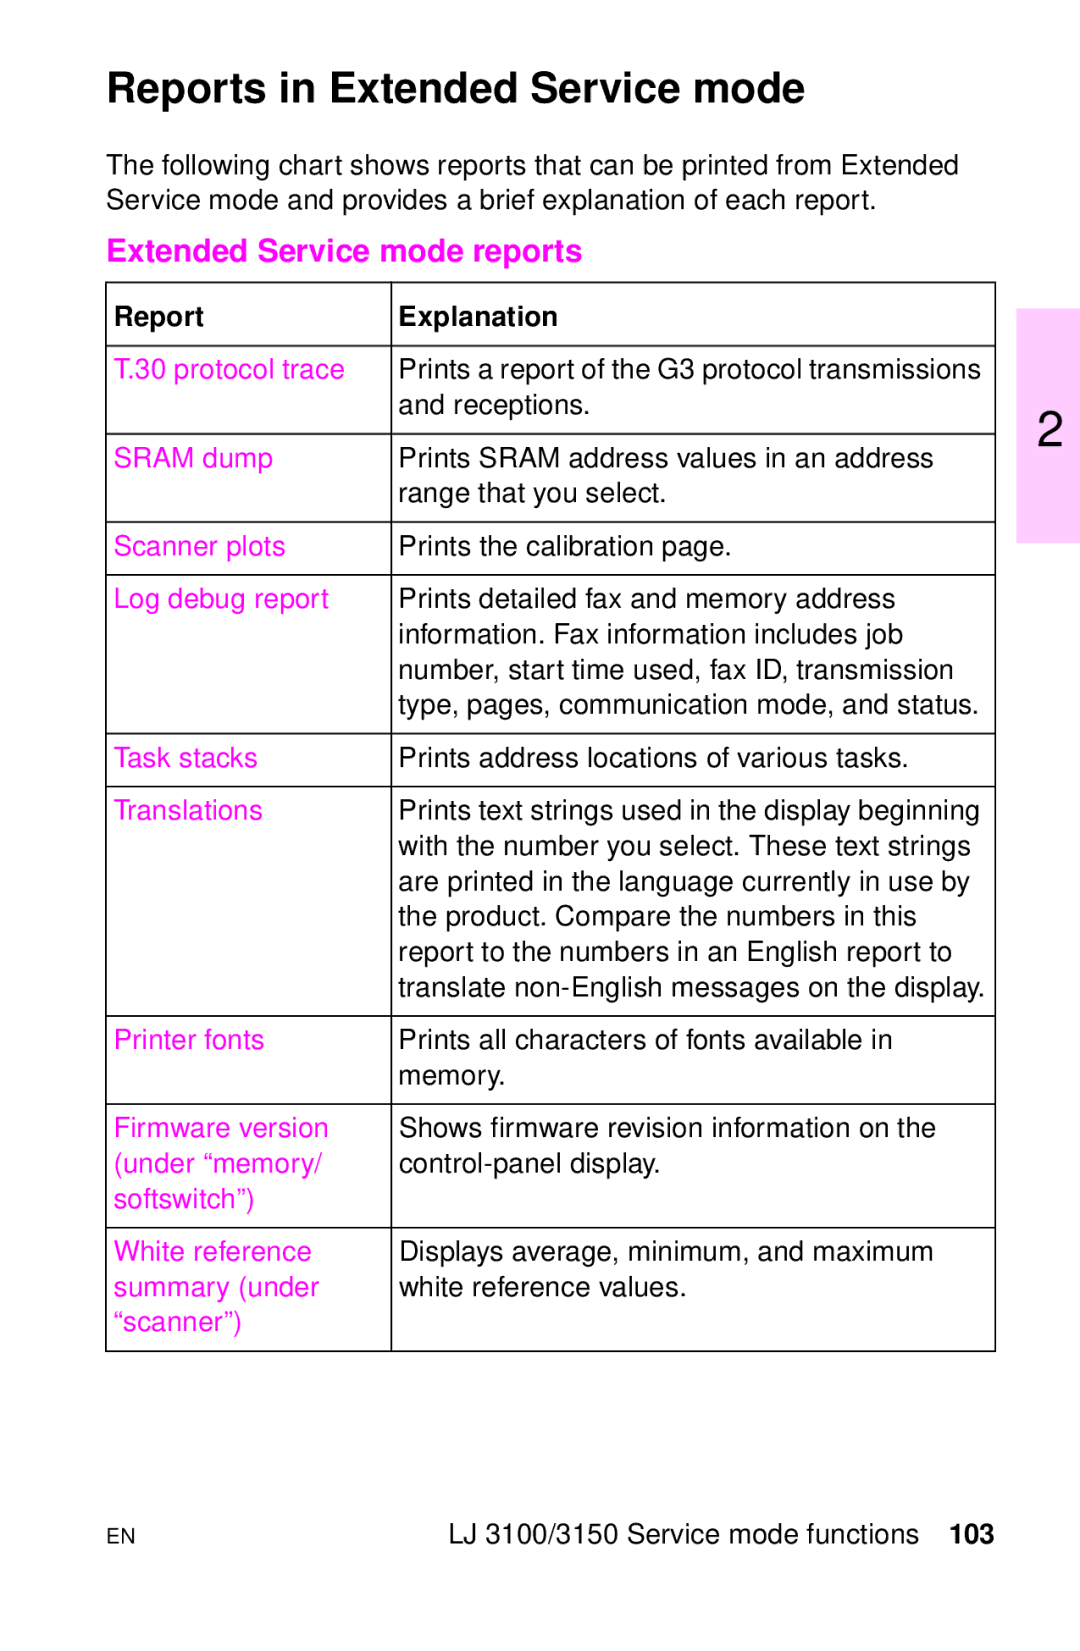
Reports in Extended Service mode
Extended Service mode reports
Report Explanation
Clear memory in Extended Service mode
To change the country code softswitch
Softswitches
Country Code
Country code softswitch sequences
Hardware, software, and firmware compatibility
Firmware and software downloads
To recalibrate the document scanner
Recalibration of the document scanner
To calibrate the document scanner
Secondary Service menu
LJ 3200 Service mode functions
To gain access to the Secondary Service menu
Service menu Main menu Submenu
To gain access to the Developer’s menu
Developer’s menu
Main menu Submenu
Country codes
To adjust a country code parameter
To adjust a fax data-store parameter
Diagnostic mode
To perform this test Press these buttons
To gain access to Diagnostic mode
To exit Diagnostic mode
To check buttons in Diagnostic mode
To perform an Nvram initialization
Nvram initialization
PJL software commands
DESKTOP, PSTEXT, Vnintl
Nvram PJL factory variables
LJ 4100 Service mode functions
Changing settings
Count
Changing the page count example
Button press Display Description
Page
Diagnostics
Cold reset paper
Clear event log
Top margin
Trays 2 and 3 left margin
Tray 1 left margin
Engine test
Testing the printer
Clearing Nvram
Cold reset
To initialize the hard disk
To initialize Nvram
Power supply
AC power distribution
AC and DC power distribution
DC power distribution
HP LaserJet 1200 Series printer
Overcurrent/overvoltage
HP LaserJet 2200 Series printer
HP LaserJet 3100 and 3150 Series printer
Overcurrent/overvoltage
HP LaserJet 3200 Series printer
Overcurrent/overvoltage
HP LaserJet 4100 Series printer
AC/DC power distribution
Low-voltage power-supply circuit LJ 4100 series Power supply
Overcurrent/overvoltage protection
Fuser over-temperature protection
Protection systems
Input/output I/O
Bidirectional interfaces
Printer-interface connections Bidirectional interfaces
Attaching the parallel cables
LocalTalk I/O
Network interfaces
Expanded I/O
EIO disk
IR interface
Using the FIR port
EIO troubleshooting
Communications troubleshooting
Communications check
Test message
Cable Length
Maximum I/O cable lengths
Input/output I/O
Media specifications
Size Dimensions Metric dimensions
Size Metric dimensions Dimensions
Paper sizes
Metric system
Paper specifications
Paper specifications
Paper grades basic sizes and basis weights
Category Specification
Paper grades
Paper grades
Weight equivalence table
Weight equivalence table
Weight equivalence table
Media to avoid
Troubleshooting media problems
Paper curl
General tips
Envelope specifications
Envelope specifications
Category Specifications
LJ 2200 printer only 100 g/m2 27 lb
Envelope sizes
Envelopes to avoid
Preventing jams caused by envelopes
Envelope construction
Envelope feeding
Label specifications
Label specifications
All printers except LJ 2200 Must not exceed
Preventing jams caused by labels
Transparency specifications
Transparency specifications
Preventing jams caused by transparencies
Part Number Version VHS Format
HP paper training video
Toner cartridge
Cartridge weights and page counts
Cartridge weights and page counts
Product Full weight Empty At 5% Printer Weight Coverage
Count
Potential toner cartridge issues
Banding
Character voids
Toner cracking
Transfer of toner image
Gray background on envelopes
Recycling toner cartridges
HP policy on non-HP toner cartridges
Refilled toner cartridges
Handling and storage
Toner safety
First aid measures
Clothing contact
Toner cartridge information
Printer options
Printer options and replaceable parts
Product Product description Service Number Part number
1200 2200 3100/3150 3200 4100
Enhanced
1200 2200 3100/3150 3200 4100
Envelope
1200 2200 3100/3150 3200 4100
Print servers
Product Product description Service Exchange
1200 2200 3100/3150 3200 4100
Ordering parts
Printer parts
Ordering printer parts
Common hardware
Part number Product description
Common hardware
Major assemblies
Parts for the HP LaserJet
Part number Description
HP LaserJet 1200 assemblies
Major assembly locations 1200 series, 2 Printer parts
HP LaserJet 1200 assemblies
Major assembly locations 1200 series, 3 Printer parts
902
Major assembly locations 2200 series, 1 Printer parts
HP LaserJet 2200 assemblies
Major assembly locations 2200 series, 2 Printer parts
HP LaserJet 2200 assemblies
Major assembly locations 2200 series, 3 Printer parts
HP LaserJet 2200 assemblies
Major assembly locations 2200 series, 4 Printer parts
501
Major assembly locations 2200 series, 5 Printer parts
502
Parts for the HP LaserJet 3100/3150
Major assembly locations 3100 and 3150 series Printer parts
HP LaserJet 3100 and 3150 assemblies
Major assemblies
HP LaserJet 3100 and 3150 assemblies
501
Parts for the HP LaserJet 3100/3150
Major assemblies
XB6-7300-807CN Screw, TP, M3X8
Major assemblies
HP LaserJet 3100 and 3150 assemblies
Major assemblies
HP LaserJet 3100 and 3150 assemblies
Major assembly locations 3200 series Printer parts
HP LaserJet 3200 assemblies
Major assemblies
10A
Major assemblies
XB4-7401-007CN Screw
Major assemblies
HP LaserJet 3200 assemblies
Major assemblies
XB4-7400-805CN Screw, tapping, truss head, M4x
Major assemblies
HP LaserJet 3200 assemblies
Major assembly locations 4100 series, 1 Printer parts
HP LaserJet 4100 assemblies
Major assembly locations 4100 series, 2 Printer parts
HP LaserJet 4100 assemblies
Printer parts
Image quality
Cleaning
LJ 1200 series
LJ 2200 series
LJ 3100 and 3150 series
LJ 3200 series
LJ 4100 series
Creating a cleaning
Using the auto-cleaning
Image defect table
Image defect table
Ghosting light Ghosting dark
245
Image defect details
Background scatter
Black pages
Blank pages
Blank spots
Bottom of page is blank or graphic image is cut off
Character voids
Curl or wave
Creases or wrinkles
Dirt on back
Dropouts
Distorted image
Faded print or bubbles
Ghosting light
Ghosting dark
Gray background
Horizontal black lines or smears
3150 series only
Horizontal smudges
Horizontal white lines
Light print, dark print, faded print
Misformed characters
Loose toner
3100, 3150, and 3200 series only
Repetitive defects
Random black spots or toner specks
Skewed print
Scanned images print at reduced size Series only
Tire tracks
Toner smear
Vertical black lines
Vertical dots
Vertical white lines
White spots on black
LJ 1200 series repetitive defect ruler
LJ 1200 series repetitive defect ruler
LJ 2200 series repetitive defect ruler
LJ 2200 series repetitive defect ruler
LJ 3100 and 3150 series repetitive defect ruler
LJ 3100 and 3150 series repetitive defect ruler
LJ 3200 series repetitive defect ruler
LJ 3200 series repetitive defect ruler
LJ 4100 series repetitive defect ruler
LJ 4100 series repetitive defect ruler
Image quality
Diagrams
LJ 1200 wiring diagram
LJ 1200 series diagram and paper path
LJ 1200 wiring diagram
LJ 1200 series paper path
Paper path HP LaserJet 1200 series Diagrams
LJ 2200 wiring diagram
LJ 2200 series diagram and paper path
Reference diagram HP LaserJet 2200 series, 2 Diagrams
LJ 2200 series paper path
LJ 3100 and 3150 wiring diagram
LJ 3100 and 3150 series diagram and paper path
LJ 3100 and 3150 wiring diagram
LJ 3100 and 3150 series paper path
Paper path HP LaserJet 3100 and 3150 series Diagrams
LJ 3200 wiring diagram
LJ 3200 series diagram and paper path
Wiring diagram HP LaserJet 3200 series, 2 Diagrams
LJ 3200 series paper path
LJ 4100 wiring diagram
LJ 4100 series diagram and paper path
LJ 4100 wiring diagram
LJ 4100 series paper path
Paper path HP LaserJet 4100 series Diagrams
Services and support resources and training
Lecture and lab training U.S. only Self-paced training kits
How to get training
Descriptions and part numbers
Product Description Part number
HP direct ordering for genuine HP parts
Support resources
Consumables
World Wide Web
HP service agreements
Customer care reseller sales and service support center
HP authorized re sellers and support
Other areas
291
Acronyms and abbreviations
Appendix
293
Smode
Index
Page
Index
Page
See also EIO cards
Fast infrared receiver part number 180 using
Fuses, overcurrent/overvoltage protection
High-voltage power distribution LaserJet 2200 series
Index
Page
Index
Page
Index
MS-DOS
See also part numbers parts
Page
Index
Safety, toner 173 scan buffer errors
Sram
Page
Firmware and software, LaserJet 3100/3150 series
Index
Page
5961-0953