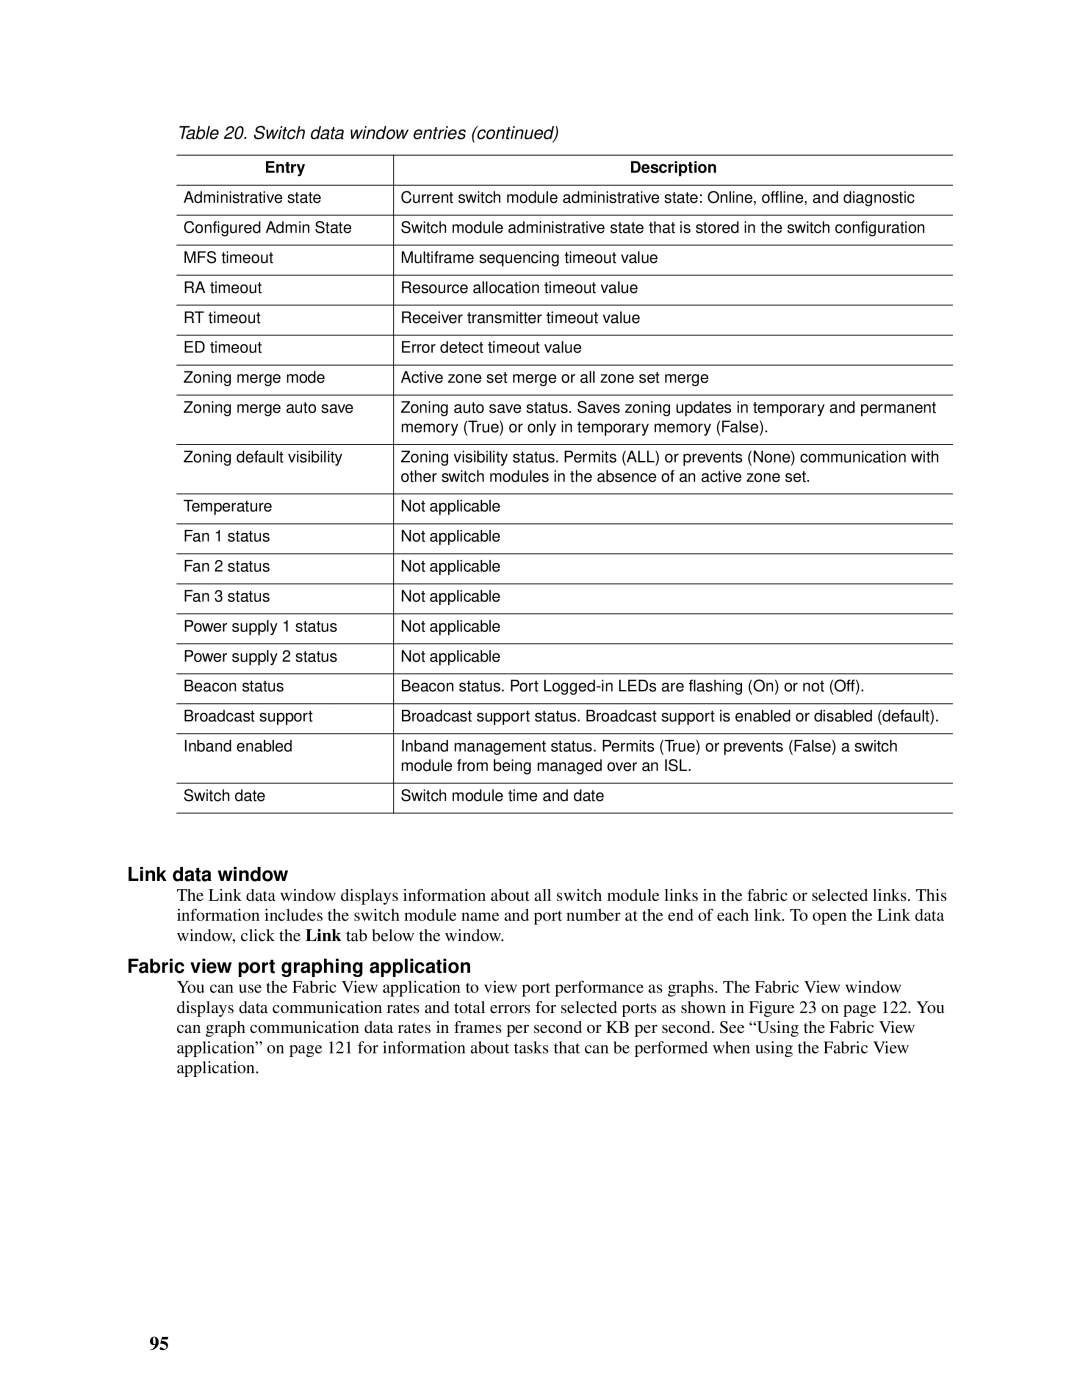
Table 20. Switch data window entries (continued)
Entry | Description |
|
|
Administrative state | Current switch module administrative state: Online, offline, and diagnostic |
|
|
Configured Admin State | Switch module administrative state that is stored in the switch configuration |
|
|
MFS timeout | Multiframe sequencing timeout value |
|
|
RA timeout | Resource allocation timeout value |
|
|
RT timeout | Receiver transmitter timeout value |
|
|
ED timeout | Error detect timeout value |
|
|
Zoning merge mode | Active zone set merge or all zone set merge |
|
|
Zoning merge auto save | Zoning auto save status. Saves zoning updates in temporary and permanent |
| memory (True) or only in temporary memory (False). |
|
|
Zoning default visibility | Zoning visibility status. Permits (ALL) or prevents (None) communication with |
| other switch modules in the absence of an active zone set. |
|
|
Temperature | Not applicable |
|
|
Fan 1 status | Not applicable |
|
|
Fan 2 status | Not applicable |
|
|
Fan 3 status | Not applicable |
|
|
Power supply 1 status | Not applicable |
|
|
Power supply 2 status | Not applicable |
|
|
Beacon status | Beacon status. Port |
|
|
Broadcast support | Broadcast support status. Broadcast support is enabled or disabled (default). |
|
|
Inband enabled | Inband management status. Permits (True) or prevents (False) a switch |
| module from being managed over an ISL. |
|
|
Switch date | Switch module time and date |
|
|
Link data window
The Link data window displays information about all switch module links in the fabric or selected links. This information includes the switch module name and port number at the end of each link. To open the Link data window, click the Link tab below the window.
Fabric view port graphing application
You can use the Fabric View application to view port performance as graphs. The Fabric View window displays data communication rates and total errors for selected ports as shown in Figure 23 on page 122. You can graph communication data rates in frames per second or KB per second. See “Using the Fabric View application” on page 121 for information about tasks that can be performed when using the Fabric View application.
95