CONFIGURING YOUR ROUTER
Bandwidth Monitor
Bandwidth Monitor appears under the Statistics Tab for the properties for a router.
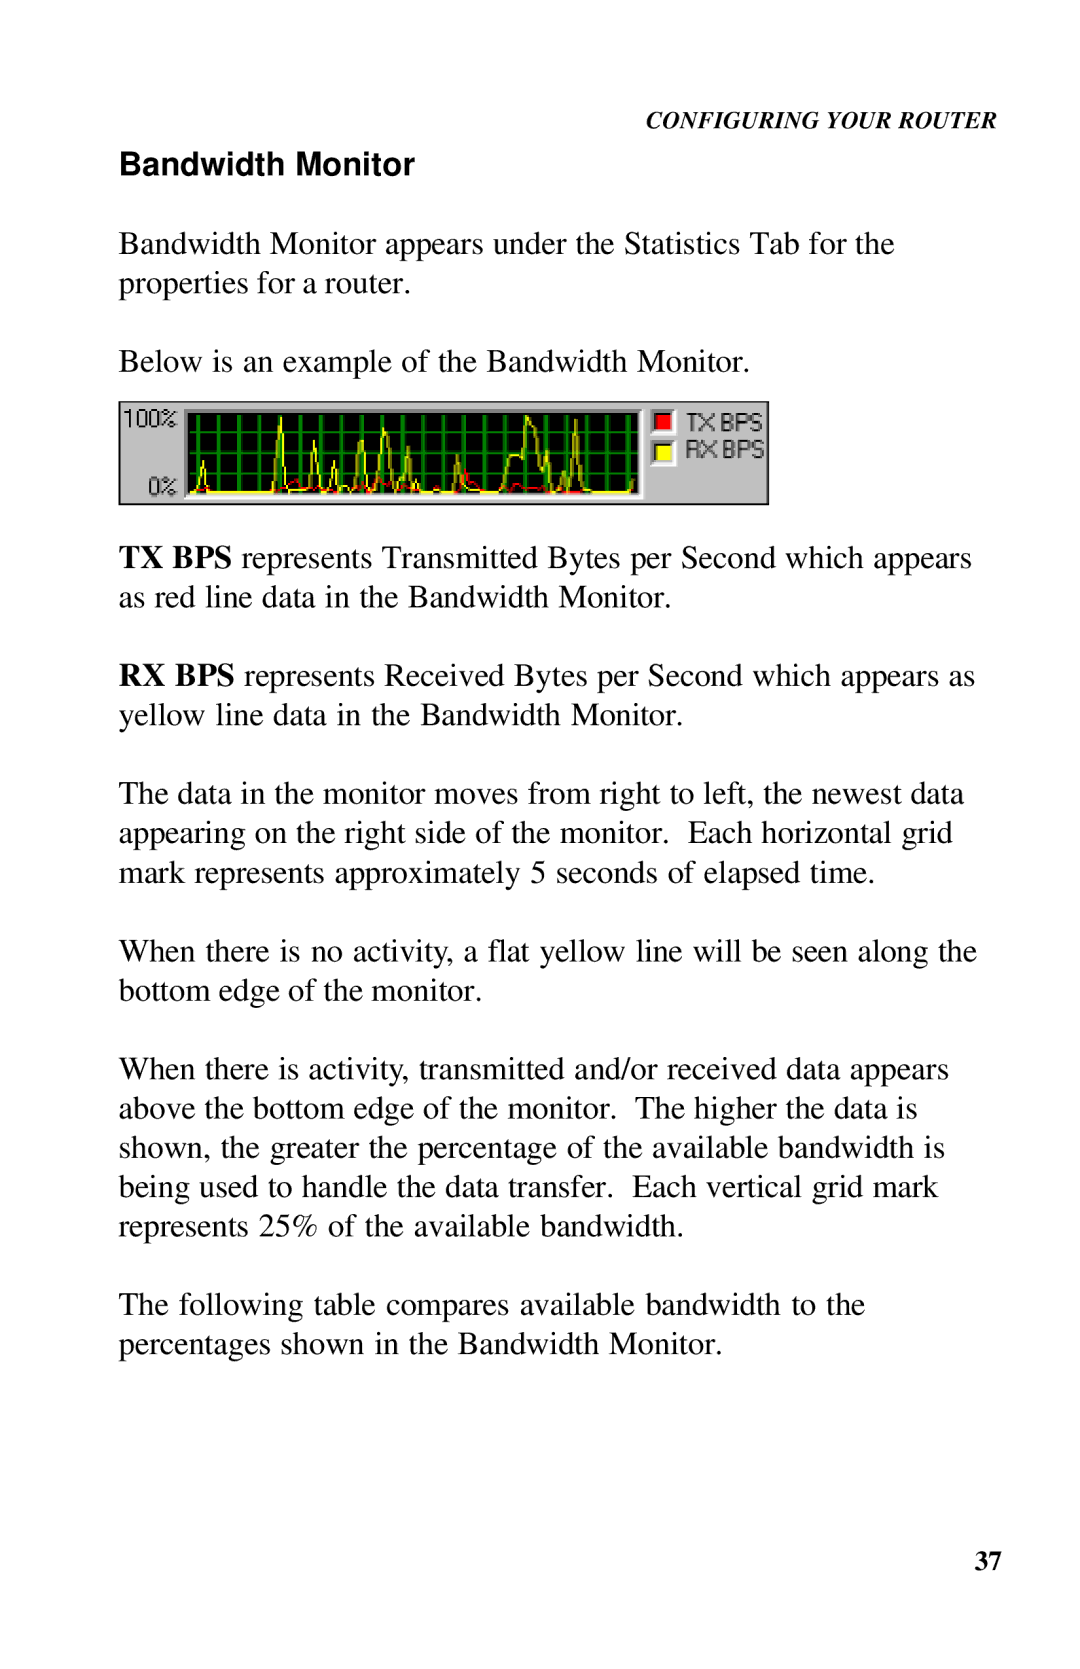
Below is an example of the Bandwidth Monitor.
TX BPS represents Transmitted Bytes per Second which appears as red line data in the Bandwidth Monitor.
RX BPS represents Received Bytes per Second which appears as yellow line data in the Bandwidth Monitor.
The data in the monitor moves from right to left, the newest data appearing on the right side of the monitor. Each horizontal grid mark represents approximately 5 seconds of elapsed time.
When there is no activity, a flat yellow line will be seen along the bottom edge of the monitor.
When there is activity, transmitted and/or received data appears above the bottom edge of the monitor. The higher the data is shown, the greater the percentage of the available bandwidth is being used to handle the data transfer. Each vertical grid mark represents 25% of the available bandwidth.
The following table compares available bandwidth to the percentages shown in the Bandwidth Monitor.
37