OPERATOR’S Manual
LBA-PC
LBA-PC
Equipment Setup
Installation of the Frame Grabber Board Camera Connections
For Windows 2000 and Windows XP Pro
Optical Radiation Hazards Electrical Hazards
Menus and Dialog Boxes
Camera... selection and display resolution
Capture Toolbar... design the toolbar contents
Aperture... display and define apertures
Capture... define acquisition method and processing
Display Windows
Triggering Types & Capturing Methods
What is Ultracal
Computations
Integration Operation
Digital Camera Control
Active X
Digital Camera Option
Remote Operation
Remote Gpib Operation
General Information
System Requirements
Optional Equipment
Specifications
Power Requirements
Electrical Hazards
Safety Considerations
Optical Radiation Hazards
Equipment Setup
Installation of the Frame Grabber Board
LBA-300PC
LBA-7XXPC -D LBA-PC-PIII
LBA-PC
Four Camera Option Operator’s Manual
Camera Connections
LBA-PC Software Installation
Analog Cameras
Digital Cameras
First Method Windows XP
Start, Programs, Spiricon, LBA-PC, LBA-PC
Start LBA-PC
Second Method Windows 2000 or XP
Collect Data
Configure Camera Type
Sample Configurations
Error Messages
LBA-PC device driver not found LBA-PC set to Off-Line mode
Click on the Sound, video and game controllers listing
Unable to load LCA program file File Not Found
Not a valid LBA-PC data file
Frame Grabber not found LBA-PC set to Off-Line mode
Connections
SHUT3 SHUT2 SHUT1
Camera Power
Shutter Controls Signals
Camera Control Cables
Trigger Out
Pass/Fail Out
Trigger
Special Setup for Pyrocam I Operation
Pyrocam I Setup Requirements
Pyrocam I with Non-Digital LBA-PC’s
LBA-300/400/500/708/710/712/714PC Digital camera option
Setup requirements for LBA-PC with pyrocam cameras
Some Restrictions apply when interfaced to a Pyrocam
LBA-500/7XXPC-D w/ Digital Camera Option
Pyrocam I with Digital LBA-PC’s
Image synchronization considerations
LBA-500/7XXPC-D Setup requirements
Image Synchronization Considerations
File. . . Drop Down Menu Selections
File Load
Load Frame Dialog Box
Drag and Drop Data Frame Loading
File Save As…
Special Frame Numbers
Export Image… to a disk file
Save As … Dialog Box
Export Image… dialog box
Set Reference, copy the current to the reference frame
Save Config… to a file
Restore Config… from a file
How to generate gain
What is Gain Correction?
What Disables Gain Correction?
Generate Gain
File Load Gain…
File Save Gain As…
Gain Off/On
File Logging
Beginning and Terminating Logging
Data, Results & Export Logging, dialog box
Logging Method
Pass/Fail Filter
Combinations using Logging, Statistics and Block Mode
Combinations using Logging, Statistics and Post Processing
File Print…
File Save Frog as…
File Print Setup
File Exit
Save Frog as…Dialog Box
Frog Data Orientation
Frog Data Collection Tips
LBA-PC
Options... Drop Down Menu Selections
Hide/Show Capture, Display, Aperture Toolbar
Aperture... display and define apertures
Aperture Shapes
How to create a Drawn Aperture
Drag and Drop Apertures
Using Auto Apertures
Display Beam Width
Creating a new Camera Type
Camera... selection and display resolution
Camera type selection
Resolution and Frame Size
Click on Save CAM
Frame Buffer Size
Am I using Virtual Memory yet?
Sync Source
Pixel Scale, Pixel Units
Gamma Correction
Lens
Special Camera Settings
Capture... define acquisition method and processing
Capture
LBA-PC
Capture Interval
Camera
LBA-PC
Trigger
LBA-PC
Processing
Frame Summing
Frame Average
Gain Correction
Reference Subtraction
Capture Toolbar... design the toolbar contents
Computation... Energy calibration select results items
Logging
Print
Write Protect
Energy Calibration Procedure
Quantitative display, on/off
Total energy Aperture
Min
Beam Width Method
LBA-PC
Top Hat
Elliptical
Gauss Fit
Divergence
Histogram
Statistics
Beam Display... define the beam display
Cursor Orientation
Beam View
Cursors
Origin Location
Beam Colors
Axis Scale
Beam Display
Set Reference Source
Display Thresholds
Color Bar
7.13 2D Only Beam Display Items
Copy Image to Clipboard
Copy Image to Wallpaper
7.14 3D only
LBA-PC
Beam Display Toolbar
Beam Stability
Main Controls
Strip Chart Controls
LBA-PC
Peak/Centroid Scatter Plot and Histogram
Options Beam Display
Options Camera Pixel Units
Options Camera
∝ m
LBA-PC
Option Camera
Create Palette…
LBA-PC
Saving the Palette
Save Colors
Load Colors
Clearing Colors
Pass/Fail... Drop Down Menu Selections
Password Lockout
Pass/Fail... enable and define its operation
Quantitative Pass/Fail
Pass or Fail results
Pass/Fail Units
Pass/Fail dialog boxes
Elliptical Pass/Fail
Gauss Pass/Fail
Top Hat Pass/Fail
Centroid
Window... Drop Down Menu Selections
Top Hat Fluence
How to Ultracal
Start!/Stop!... a Toggle Menu Action Item
Ultracal! Menu Action Item
Tile
What Disables Ultracal
AutoExposure!… Menu Action Item
AutoExposure! Operation
AutoExposure Interacts with Ultracal
Operator’s Manual 104
Operator’s Manual 105
Main Window
Beam Display Window
Frame Comment
LBA-PC
Results Display Window
Shortcuts
Shortcuts
Pan/Zoom Display Window
Hardware Zooming
Analog Camera Zooming
Digital Camera Zooming
Soft Zooming
Panning
Tilt/Rotate Display Window
Zooming and Panning Constraints
Histogram Display Window
Shortcuts using the Mouse
Operator’s Manual 117
Triggering Types & Capturing Methods
Triggering the LBA-PC
Trigger Type CW
Type Trigger Out
Interlaced Cameras
Non-interlaced Cameras
Trigger Delay
CCD Frame Transfer Camera, Interlaced
CCD Interline and Full Frame Transfer Camera, Interlaced
Cmos Camera, Interlaced
Type Trigger
Type Video Trigger
Capture Methods and Rate Control
Programming the Capture Interval
CCD Frame and Interline Transfer Cameras, Interlaced
With Trigger Type set to CW
Integration Control
With Trigger Type set to Trigger Out
Digital Camera Operations
Integration Operation
Digital Camera Control
Digital Camera Binning Effects
Digital Camera Triggering
Digital Camera ROI Formating
Digital Camera Exposure Controls
Digital Camera Gain and Black Level Control
Operator’s Manual 127
Computational Accuracy
Numerical Formats
Manual Background Energy Nulling
What is Ultracal
Beam Presentation Affects Results
Total Energy
What is the Clip Level and how is it used?
Clip Level
Percent in Aperture
Peak and Min
Peak Location
Centroid Location
Beam Widths and Diameters
11.1 D4-Sigma Method
= ∑x ∑y y − y2 ⋅ Zx, y
Knife Edge Method
Percent of Peak Method
Elliptical beam
Percent of Energy Method
Gauss Fit
Whole Beam fits Line fits are X/Y or Major/Minor aligned
Whole Beam fit equations
15 X/Y or Major/Minor line fit equations
Deviation of Fit
Correlation of Fit
∑ Z
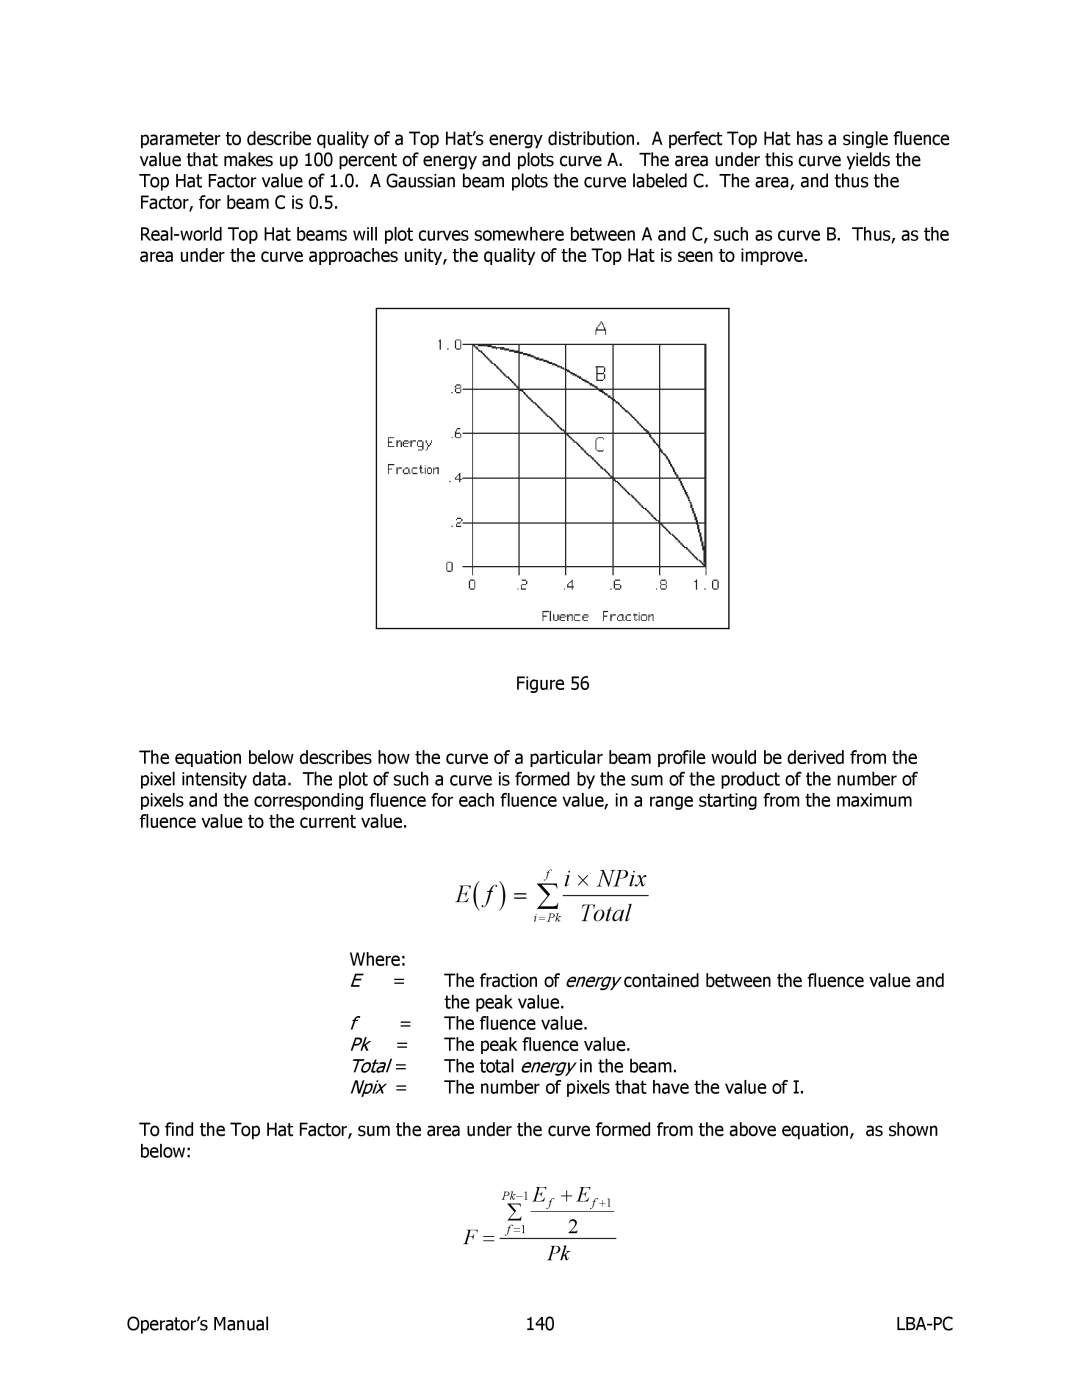
Top Hat
Top Hat Minimum and Maximum intensities
Top Hat Factor
Top Hat Mean and Standard Deviation
= ∑f i ⋅ NPix = Pk Total
Focal Length Method
Effective Area and Effective Diameter
Far-Field Divergence Angle computations
Histogram
Far-Field Method
∑ S
Statistics
Frame Averaging
Frame Summing
Gamma Correction
Z 1/ g
Convolution
Operator’s Manual 147
Digital Camera Option
I/O Connections
Digital Camera Connections for LBA-7XX Model Frame Grabbers
Vsync
VD11-0+/-… LBA-400/500
VD15-0+/-… LBA-7XX
SHT#… LBA-400/500 only
RST… LBA-400/500 only
Special Jumper Cutting Requirements LBA-400/500 only
Digital Camera Advanced Timing Setup
Transfer Mode
Scan Mode
Vertical Start
Horizontal Size
Vertical Size
Horizontal Start
Digital Camera and Ultracal Operation
LBA-PC
How to Disable Remote Operation
Remote Operation
Operator’s Manual 157
Microsoft Excel
Using ActiveX
Introduction
Visual Basic Visual Studio
Properties, Methods, and Events
LabVIEW
Properties
AppInfo
Running
OperationComplete
OperationError
NewFrame, HoldNewFrame
FrameData, FrameWidth, FrameHeight
PixelHScale, PixelVScale
CrosshairX, CrosshairY, CrosshairZ
CursorDelta
EnergyOfBeam
Bitmap
Results
Quantitative Results
Elliptical Results
Gauss Fit Results
Top Hat Results
Divergence Results
Statistics Results
Pass/Fail Results
Open
LoadConfig
Methods
OpenIndex
Start
Stop
Ultracal
OnNewFrame
Events
Auto Exposure
Dcom
OnOperationComplete
False
True
Remote Access
Server LBA-PC Computer
Client Application Computer
If you have a problem
LBA-PC
AT-GPIB/TNT PCI-GPIB PCI-GPIB+ PCMCIA-GPIB PCMCIA-GPIB+
Remote Gpib Setup
Hardware and Software Requirements
LBA-PC
Command Formats and Responses
Ieee 488.1 Command Support
Ieee 488.2 Common Commands
LBA-PC Command and Data Formats
Establishing Remote Control
DAB
Configuration Commands
Restore and Save Configuration Files
LDC Restore Config…
SDC Save Config…
Configuration Commands
APT?END
Minor=7.500E+00 Rotation=0 DisplayShape=0 AutoAperture=1
DAW
Transfer Commands
Transferring Raw Data
10.6.1.1 RCC?, RCR? Read Cursor Transfer
RCR?END
10.6.1.2 RDD? Read Frame Transfer
Transferring Data Files
RDD?END
10.6.2.1 FRM? Download Data Frame
FRM?
FRM
LDD
FRM Upload Data Frame
FRM
LDD Read Data File
FrameNumber=33 #6124928DAB…DABEND
SDD Save Data File
10.6.2.5 RDR? Read Results
RDR?
LOG Logging
10.6.2.7 FST? Transferring Status Information
FST?
Spatial Coordinates
10.6.3 PFS? Pass/Fail Status
10.7.2 Pan/Zoom Window Detector Coordinates
Coordinate Systems
DIS Set Manual Origin Location
PAN Set Capture Window Location
PAN?END
Frame Coordinates
Beam Window World Coordinates
Error Messages
LDC
LDC cannot load config while runningEND
Service Request Response
STB
ESR
ELR
Operator’s Manual 210
Ieee 488.1 Command Support
UNL
Ieee 488.2 Common Commands
Command Meaning Usage
Return ESE contents
Bit 5 Event Status bit, ESB, set
Service Request Generation
ESE, *ESE? ESR?
LBA-PC Command and Data Formats
Configuration Command Parameters
CCC =
Type Description
LBA-PC Configuration Commands
LDC restore configuration
File Menu
Key Type Value Description
SDC save configuration
LDD load data from file
SDD save data to file
Key Type Value Description
BMP
EXP set export configuration & export images
LOG set logging configuration
FRM and RDD are ignored if the LBA-PC is Not in remote
PRN set print configuration and print
GAI generate gain frame
REF set reference
GAI3
APT set aperture configuration
Options Menu
CAM set camera configuration
CAP set capture configuration
Key Type Value Description
Key Type Value Description
COM set computations configuration
PAN
Operator’s Manual 230
DIS set display configuration
Key Type Value Description
EnergyOfBeam=0 then the range is 0 to
PSW enter password
PFF set pass/fail master configuration
Pass/fail quant configuration
Pass/Fail Menu
Key Type Value Description
Pass/fail elliptical configuration
Pass/fail gauss configuration
Key Type Value Description
Key Type Value Description
Pass/fail top hat configuration
Key Type Value Description
CAL ultra cal
Remote Specific Commands
3.6 Pass/fail divergence configuration
CHR read/write cross hair location
CUR read/write cursor location
CHR?
CUR?
ERR?
ERR error reporting
DSF display frame
Message Error Type Description
Executionerror
Commanderror
Rangeerror
Executionerror LDD, SDD, DIS
Executionerror LDD, DIS
Executionerror LDD, SDD
Executionerror SDD
Message Generated By
Executionerror CHR
REM
Message Generated By
Message Generated By
Message Generated By
FRM upload/download a data frame
FST frame status information
MM/DD/YY
HHMMSS.DD
LOC go to local
PAN pan left/right/up/down
ORG set manual origin to cursor location
4.10 PAL? read color palette
PNW?
PNW pan window limits
PAN?
PFS?
4.13 PFS? read pass/fail status
4.14 RCC? read cursor column
4.15 RCR? read cursor row
Key Type Value Description
4.16 RDD? read raw data
LBA-714PC
4.17 RDR? read results
RDR
REM go to remote
RUN start running
STP stop running
STT start/stop toggle
WLD?
4.23 WLD? read current frame boundaries
ZOM zoom in/out
Footnotes
ZMM zoom information
ZOM?
ZMM?
Operator’s Manual 264
LBA-PC Remote Control Capabilities
Virtual Instrument VI Examples
VI Libraries
\ Spiricon \ Lbapc
Basic SubVI Library Examples
Auto Aperture ON/OFF
Comma String to Array
Display Beam Frame
Do Ultracal
Frame SRE
Get Basic Results
Get Frame Status Info
Get Palette
Get Pan Location
Get Tophat Results
Get Version
Move Cursor
Move Pan
Read Basic Cursor info
Read Cursor Column/Row
Restore Configuration
Read Divergence Results
Results SRE
Run Stop
Save Configuration
General VI Examples for the LBA-PC
Semicolon String to Array
Set Energy and Units
Basic Results
Basic Results Panel
Beam Viewer
Beam Viewer Panel
Basic Divergence
Basic Logging
Basic Tophat
Load Data
Get Data
Hotkeys
Operator’s Manual 276
Index
Percent of energy
Convolution 66, 128
LabVIEW 160
Shortcuts 109, 110