Chapter 10
Harmonics
Introduction
Harmonics measures and records harmonics and interharmonics up to the 50th. Related data such as DC components, THD (Total Harmonic Distortion), and K-factor are measured. Harmonics are periodic distortions of voltage, current, or power sinewaves. A waveform can be considered as a combination of various sinewaves with different frequencies and magnitudes. The contribution of each of these components to the full signal is measured. Readings can be given as a percentage of the fundamental, or as a percentage of all harmonics combined (rms value). Results may be viewed in a Bar Graph display, a Meter screen, or a Trend display. Harmonics are often caused by non- linear loads such as DC power supplies in computers, TV’s and adjustable speed motor drives. Harmonics can cause transformers, conductors, and motors to overheat.
Bar Graph Screen
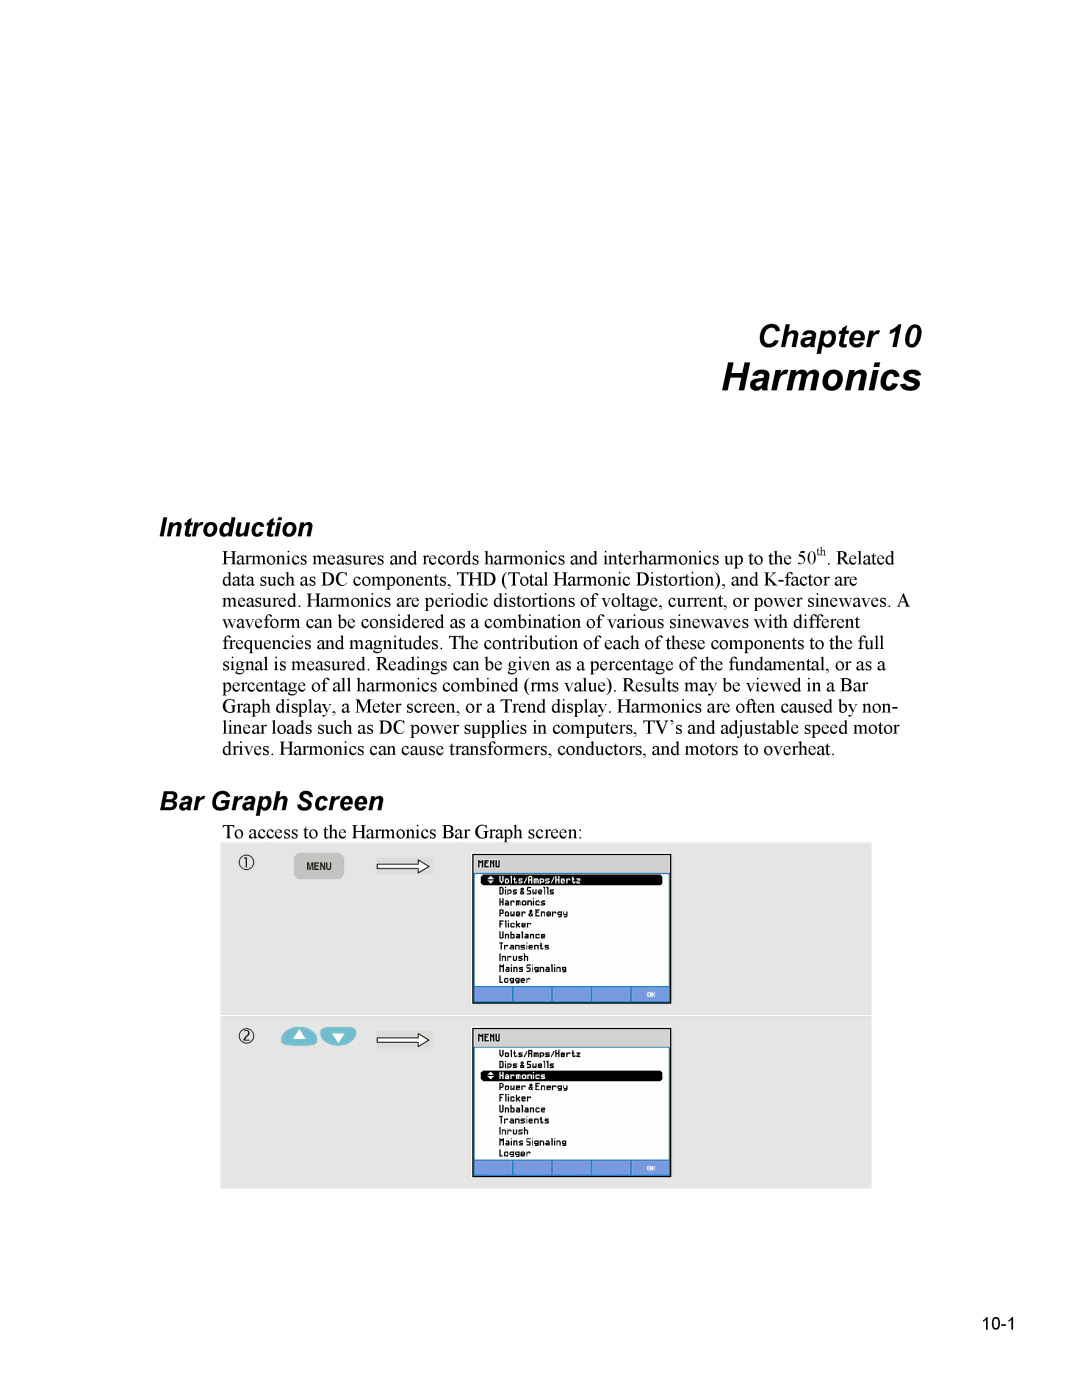
To access to the Harmonics Bar Graph screen: