Fluke 434/435
Users Manual
d
ENTER
Press ENTER to obtain trend display with the cursor on and positioned on the highlighted event in the table.
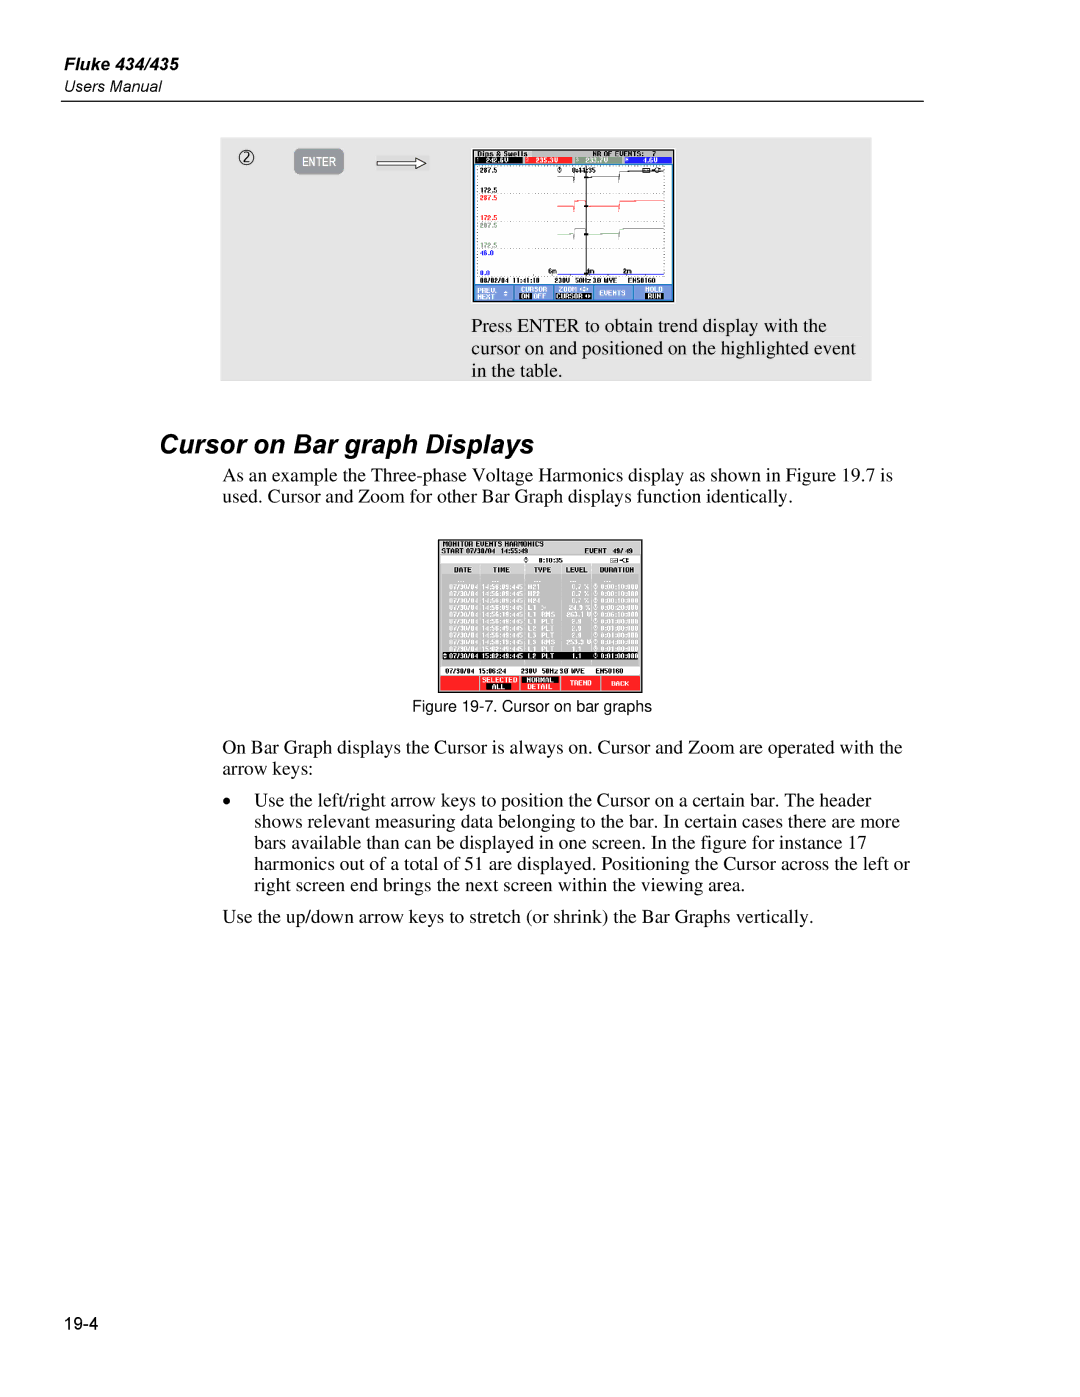
Cursor on Bar graph Displays
As an example the
Figure 19-7. Cursor on bar graphs
On Bar Graph displays the Cursor is always on. Cursor and Zoom are operated with the arrow keys:
•Use the left/right arrow keys to position the Cursor on a certain bar. The header shows relevant measuring data belonging to the bar. In certain cases there are more bars available than can be displayed in one screen. In the figure for instance 17 harmonics out of a total of 51 are displayed. Positioning the Cursor across the left or right screen end brings the next screen within the viewing area.
Use the up/down arrow keys to stretch (or shrink) the Bar Graphs vertically.