Chapter 19
Cursor and Zoom
Introduction
This chapter explains how to use Cursor and Zoom to display and investigate details of Waveform, Trend, and Bar Graph displays. Cursor and Zoom have a certain amount of interaction and are both operated by the arrow keys.
The Cursor is a vertical line that can be positioned on a point on a Waveform, Trend, or Bar Graph. The measured values at that point are displayed in the screen header.
Zoom allows you to stretch and shrink the graph to get a better view of details. Horizontal Zoom is available for Waveform and Trend.
Cursor on Waveform Displays
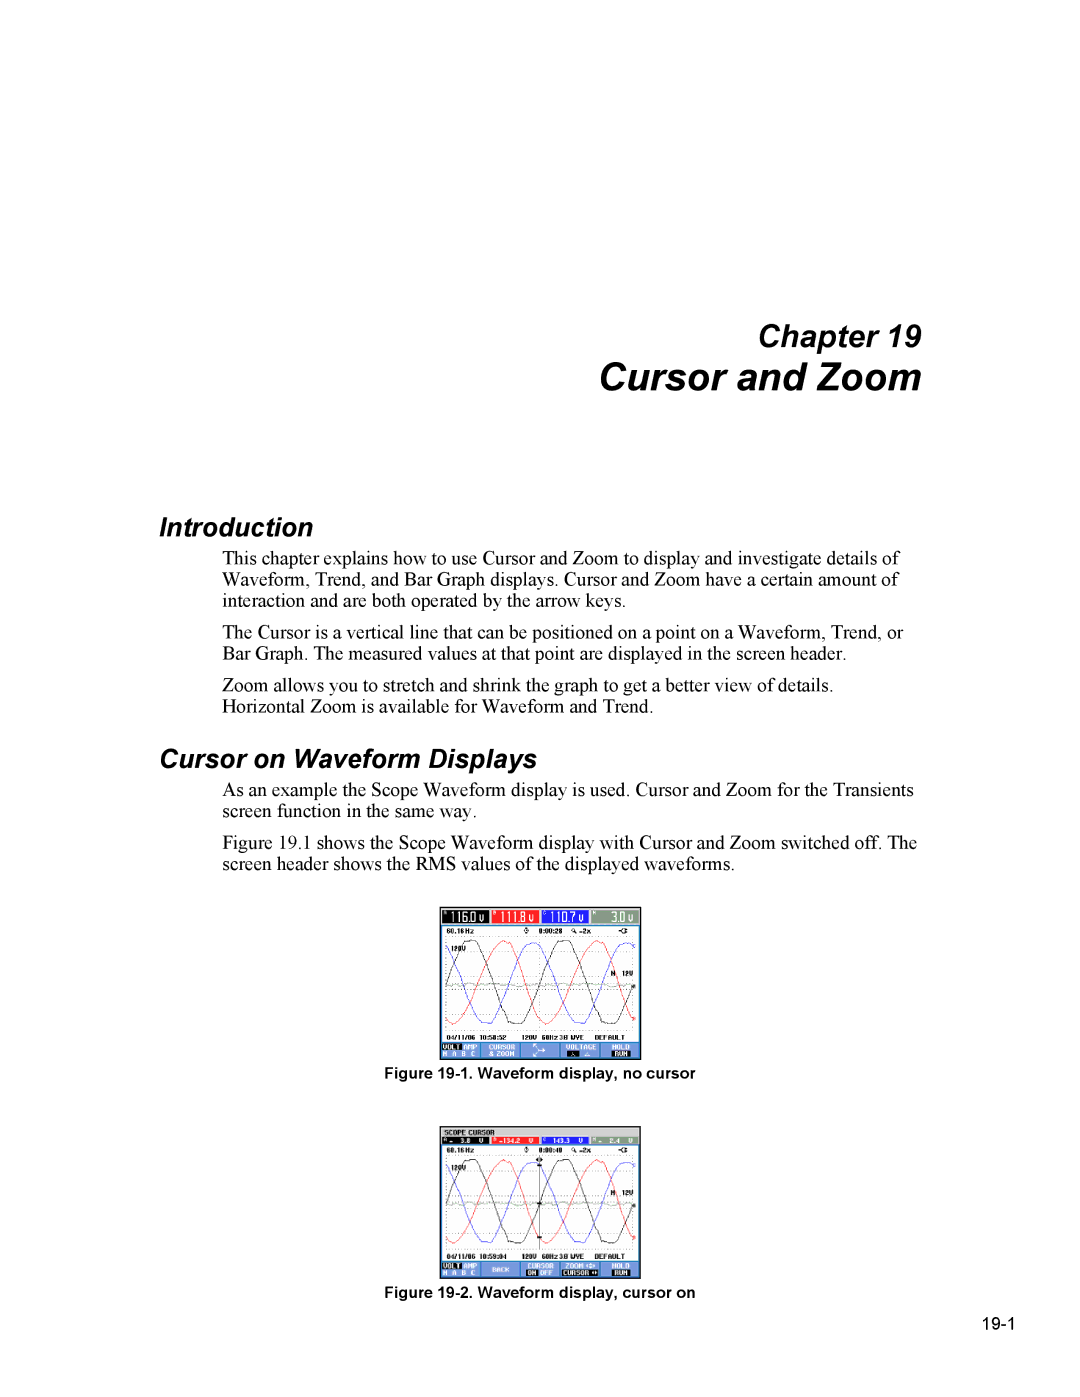
As an example the Scope Waveform display is used. Cursor and Zoom for the Transients screen function in the same way.