Performance Tests and Adjustments Manual
Page
Certification Warranty
Assistance
Safety Symbols
General Safety Considerations
Troubleshooting Repair Manual
Section Troubleshooting Repair Manual
HP 85662A IF-DisplayIF-Display Section service information
HP 8568B Spectrum Analyzer Documentation Outline
Contents
Adjustments
Crystal Filter Bypass Network Configuration
IF-Display Section Figure Index RF Section Figure Index
Figures
Contents-5
Typical Bandpass Shift t 128
If Section, Bottom View
Lhbles
General Information
Introduction
Option 462 Instruments Option 857 Instruments
HP 8340A HP 8640B HP 3335A HP 8116A HP 3312A HP 5061B
Oscilloscope
Frequency Counter Electronic = Universal Counter
Probe 10 1 Divider, compatible with oscilloscope HP 10432A
Page
Power Splitter Directional Bridge
DB Attenuator
Termination
Low-Pass Filter
Test Cable BNC m to SMB Snap-On f SMA m to SMA m HP5061-5458
Figure l-l. Service Accessories, HP Part Number
08505-60109
Performance Tksts
Able 2-1. Performance Test Cross-Reference
Specification uncorrected
Center Frequency Readout Accuracy ‘I&t
Center Frequency Readout Error Measurement
MHZ\I
Specification
Frequency Span Accuracy lkst
Equipment
83640A
1250-1250
5061-5458
10 Hz
Sweep Time Accuracy Test Setup
Sweep Time Accuracy Test 220 ms
Procedure
KHz
18 ms
Repeat steps 5 and 6 for each sweep time setting in Table
100 ms 90 ms
20 s 200 s 32 s 48 s
Start-Up Time Measurement Sweep Time
20 ms 50 ms 100 ms 500 ms 10 s 50 s 100 s 150 s
Specification &20%, 3 MHz
Resolution Bandwidth Accuracy Test
10 dBm
MHz 900 kHz 100 MHz
90.0 kHz 110.0 kHz
00 kHz 11.00 kHz KHz
200 kHz
Page
DB Bandwidth Measurement
6OdB
MHz 20 MHz 100 Hz 15l 15 MHz 300 Hz 300 kHz
100 kHz MHz
30 kHz 500 kHz
Resolution Bandwidth Switching Uncertainty Test
Procedure 1. Press
DBm
Press LOG Enter dB/bIvj and key in 1 dB. Press Marker
IlIl.00 Zto.50 Ito F0.50 DZo.50 F0.80 F2.00
Page
Fl dB
+lO Fl dB
Specification Signal Input
Related Adjustment Slope Compensation Adjustment
Frequency Response Test
~tl.5 dB, 100 Hz to 1.5 GHz DB, 100 Hz to 500 MHz
Additional Equipment for Option
100
Synthesized Sweeper
120 s
5GHz
12. Frequency Response Measurement 20 MHz to 1.5 GHz
Option 001 + 4 dBm
Page
KHz to 20 MHz MaximumdBm MinimumdBm
100 kHz
Set function generator controls as follows
Hz to 1.5 GHz from steps 15, 16, 25, 42, or
Spec ~3 dB Overall Maximum DBm Minimum Deviation
Page
16. RF Gain Uncertainty Measurement
If Gain Uncertainty Test
DBm to -55.9 dBm DBm to -129.9 dBm
Procedure 1. Press Instr pfwm
LOG
18. if Gain Uncertainty Measurement
19. if Gain Uncertainty Measurement 2 dB
Largest Positive Deviation Negative
Amplitude
Page
Log Scale Switching Uncertainty Test
F0.5
Related Adjustment
Amplitude
Fidelity Test
For instruments with Option 857, refer to Chapter
+lO ~f1.5 dB
Linear Fidelity 10. Key in analyzer settings as follows
JEGi 300 Hz
10.87 23.10 17.72
Average Noise Level Tkst
501 HZ
80 dBm
1Hz
23. Average Noise Level Measurement
Residual Responses Test
Procedure 1. Press Instr Preset
60 dBm
Option
Spurious Responses Test
Synthesized
Frequency
3335A
Ii 84&A Opt
Performance Tests 2
26. Intermodulation Distortion Test Setup
Intermodulation Distortion
211 2f2
Fl fz
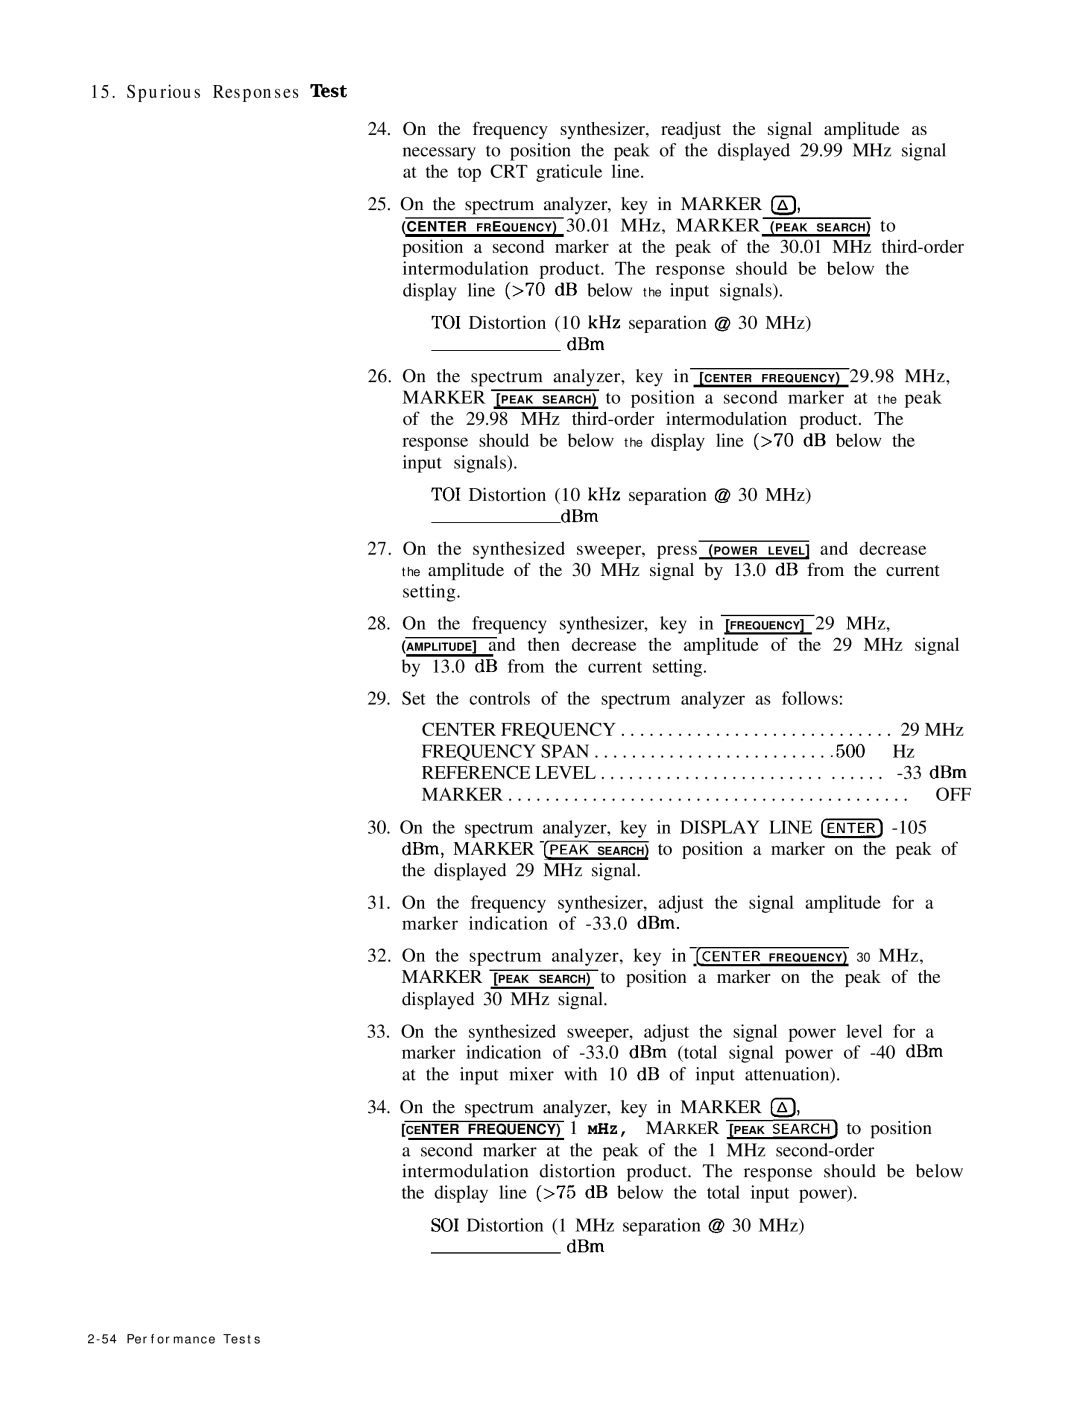
Center Frequency 1 MHZ, Marker Peak Search to position
Spurious Responses Test
Residual FM Test
Hr RF -I... L 1u
29. Slope Detected Residual FM
Performance Tests 2
Specification Description Equipment Procedure
Line-Related Sidebands Tests
10 dBm
Wait for completion of sweep, then press Marker
DBm
20 MHz
Wait for completion of the sweep, then press Marker
32. Calibrator Amplitude Accuracy Test Setup
Calibrator Amplitude Accuracy Test
Related Adjustment None
Universal
HP 5316A
HP 8340A
Triangular wave
Approximately 1 Vp-p
CAL position
SYM CAL position
F0.02 F0.05 10.0 fO.1 200 50.0 Iko.5 100 100 fl
St LO Output Amplitude Test
Specification Aging Rate
Frequency Reference Error Test
Related Adjustment Time Base Adjustment
Page
‘lhble 2-19. Performance Tkst Record
Tkst 1. Center Frequency Readout Accuracy Test
Steps 7, 9, and 11. Wide Span Error
Span Error 1Freq Span Spec ADUT- ASyn Min Max From ‘able
‘I&t 2. Frequency Span Accuracy Test
Test 2. Frequency Span Accuracy Test
Test 3. Sweep Time Accuracy
Sweep Time Accuracy, Sweep Times 220 ms Marker a Time
Min Measured Max
Min Measured
Test 4. Resolution Bandwidth Accuracy
‘I&t 4. Resolution Bandwidth Accuracy
Marker a Readout of 3 d 3 Bandwidth Min Measured Max
Test 5. Resolution Bandwidth Selectivity
Videobw 6 0 dB
Bandwidth 60dB BW t DB BW
MHz 20 MHz 100 Hz 15l 1MHz 15MHz
Test 6. Resolution Bandwidth Switching Uncertainty Test
Bandwidth Switching Uncertainty
Deviation
Readout, dB Allowable Deviation
Test 7. Input Attenuator Switching Uncertainty Test
Input Attenuator Switching Uncertainty
+lO
Deviation Amplitude Ztl dB Kl dB Fl dB
Test 8. Frequency Respons g
Kep Signal Input
Test 8. Frequency Response Test
Nd LO Shift Min Measured Max
Test 9. RF Gain Uncertainty Test
+ 1.0 dB
Test 10. if Gain Uncertainty Test
F E R E N C E Level
Step
Step
Steps 25 to 28. if Gain Uncertainty SteuI Min Measured Max
Xto.5
YLkst 11. Log Scale Switching Uncertainty Tkst
HO.5
Test 12. Amplitude Fidelity ‘I&t
Test 12. Amplitude Fidelity Test
Linear Amplitude Fidelity Frequency
Allowable Range
Test 13. Average Noise Level Test
Test 14. Residual Responses Test
Test 14. Residual Responses Test
Maximum Residual Response Frequency Range
Measured Measured Max Max Amplitude Frequency
Description
Tkst 15. Spurious Responses Tkst
DBm -105 dBm -100 dBm 90 dBm
Test 16. Residual FM Test
Test 16. Residual FM Test
Residual FM IMinIMeasuredIrax
Tkst Line-Related Sidebands Test
Min 1 M e a s u r e d M a x
Test 18. Calibrator Amplitude Accuracy ‘I&t
Test 18. Calibrator Amplitude Accuracy Test
CAL Output Amplitude Min
10.3 dBm 70 dBm
Sweep Time Accuracy Test ~20
Test 19. Fast
KO.02 Iko.05 10.0 fO.1 200 ps 50.0 f0.5 100 ps 100 fl
Test 20 st LO Output Amplitude Test
Test 20 st LO Output Amplitude Test St LO Output Level
Test 21. Frequency Reference Error
DescriDtion Min 1 Measured Max
Video Processor Adjustments MHz Bandwidth Filter Adjustments
Slope Compensation Adjustment
Equipment Required Adjustment Tools
Safety Considerations
Factory-Selected Components
Location of lkst Points and Adjustments
Related Adjustments
‘Ihble 3-2. Adjustable Components
Adjustment Adjustment Function Number
‘able 3-2. Adjustable Components Reference Designator
Adjustment Name
Adjustment Number Adjustment Function
SGlO
Adjustable Components Reference Adjustment Designator Name
Adjusts Linearity 12.5 to 18.6 GHz Low end A6AlOR37
Adjusts Linearity 12.5 to 18.6 GHz High end A6AlOR40
Adjusts linearity 5.8 to 12.5 GHz A6AlOR41
Adjusts linearity 12.5 to 18.6 GHz Low end A6AlOR42
‘Ihble 3-2. Adjustable Components Reference Designator
Adjustment Name Number
If Serial Prefix 3001A and Below
If Serial Prefix 2637A and Below
Function of Component
Range of Values Function of Component Procedure Or PF
’hble 3-3. Factory-Selected Components
Adjustment Range of Values Procedure 0 or PF
To 17.8 K To 13.3 K 10 38.3 to 100 to 383 to To 2.61 K
?or Serial Prefix 2813A To 2816A, and Serial Prefix 2810A
Below, see the back This table for exceptions to A4A9
Delay Compensation A6A12C2 To 0.68 PF Sets
Delay Compensation A6A12C3
Delay Compensation A6A 12C23 To 0.68 PF Sets
Not loaded for HP 85660B A6A12Cll To 0.68 PF Sets
Serial Prefix 2813A to 2816A
Serial Prefix 2810A and Below
Option
‘lkble 3-4. Standard Value Replacement Capacitors
Value pF 1BP Fart Number CD Value pF ZP Fart Number s
‘lhble Standard Value Replacement 0.125 Resistors
Value n EP Fart Number
0698-3447
0698-0082
‘Ihble Standard Value Replacement 0.125 Resistors
Value
BP Part Number
Value !I ElP Fart Number
Value fl BP Part Number 10.0 11.0 12.1
Standard Value Replacement 0.5 Resistors
Value 0 EIP Fart Number 383 422 464
Ihble Standard Value Replacement 0.5 Resistors
110K 121K 133K 147K
EIP Fart Number
Value a
Low-Voltage Power Supply Adjustments
Procedure IF-Display Section
Low-Voltage Power Supply Adjustments
Reference
IF-Display Section Low-Voltage Adjustments SN 3001A Below
IF-Display Section Low-Voltage Adjustments SN 3004A Above
Location of RF Section Low-Voltage Adjustments
RF Section
Low-Voltage Power Supply Adjustments
High-Voltage Adjustment SN 3001A and Below
High-Voltage Adjustment SN 3001A and Below
Description
High-Voltage Adjustment Procedure
High Voltage Adjustment Setup
Location of High Voltage Adjustments
Remove the protective cover from the AlA High-Voltage
Level
Level of approximately -4000 V dc. Be extremely careful
Press @%KiZi@
Focus and Intensity Adjustments
Press Display
Location of AlA Components
CRT Cut-Off Voltage
10. Waveform at AlA3TP5
Following step, a large arc of high voltage should be drawn
Discharge Procedure for High Voltage
Be careful
1. Discharging the CRT Post-Accelerator Cable
High-Voltage Adjustment SN 3004A and Above
High-Voltage Adjustment SN 3004A and Above
12. High Voltage Adjustment Setup
Approximately -2400 V dc can present even when the ac line
Level
14. Location of AlA Label and Test Point
Remove the ac line cord from both instrument sections
15. Discharging the CRT Post-Accelerator Cable
Preliminary Display Adjustments SN 3001A and Below
Preliminary Display Adjustments SN 3001A and Below
Adapters
Procedure Y Deflection Amplifier Pulse Response Adjustments
16. Preliminary Display Adjustments Setup
~000uu000000u00ur
17. Location of AlA2, AlA4, AlA5, and A3A2
Page
Rise and Fall Times and Overshoot Adjustment Waveform
20. Composite X Deflection Waveform
Press TlMEBASEI
Pulse Response of Control Gate Z Amplifier to Blank Input
Press Itrig Level .00000 V c
22 OV,, Signal
Set the oscilloscope controls as follows Press @iK
Preliminary Display Adjustments SN 3004A and Above
Preliminary Display Adjustments SN 3004A and Above
23. Preliminary Display Adjustments Setup
24. Location of AlA and A3A2
Delay 125.000 ns Press Display
Set the oscilloscope controls as follows Press Chan
Offset
Press Trig Source Level 25.0000 Press Time
27. Composite X Deflection Waveform
Amplifier to
Control Gate Z
29 OV,., Signal
Final Display Adjustments SN 3001A and Below
Description Procedure
‘Ihble 3-5. Initial Adjustment Positions
Location of Final Display Adjustments on AlA2, AlA4, and AlA
Final Display Adjustments SN 3004A and Above
31. Final Display Adjustments Setup
RI20R220R512R513 R319 R426 R437
Adjustments 3
Final Display Adjustments SN 3004A and Above
Log Amplifier Adjustments
Equipment Procedure
Related Performance Tests
Offset Adjustment Check
VTV and Atten Adjustments
Linear Gain Adjustments
Log Amplifier Adjustments
Video Processor Adjustments
Video Processor Adjustments
Related Performance Test
LOG Offset Adjust
Set step attenuator to 40 dB
Adjustments 3-7
MHz Bandwidth Filter Adjustments
37 MHz Bandwidth Filter Adjustments Setup
MHz Bandwidth Filter Adjustments
Filter Center and Symmetry Adjustments
Frequency Zero Check
Remove crystal filter bypass network near Cl4 SYM
Filter Peak Adjust
Key in Csweep Time 20 ms, Frequency Span 0 Hz, CREs 10 Hz
39. Location of 3 MHz Peak Adjustments
MHz Bandwidth Filter Adjustments Hz Amplitude Adjustments
40 .4 MHz Bandwidth Filter Adjustments Setup
A4A4 LC Adjustments
+ 10 V Temperature Compensation Supply Check
Location of A4A4 21.4 MHz LC Filter Adjustments
Location of A4A4 21.4 MHz Crystal Filter Adjustments
A4A4 Xtal Adjustments
Press Marker loFF. Key in CREsJ 30 kHz
A4A8 LC Adjustments
A4A8 Xtal Adjustments
Location of A4A8 21.4 MHz Crystal Filter Adjustments
Key in t-1 100 kHz, C-1 200 kHz, and Marker
Key in @TFTiTj 30 kHz, Frequency Span 100 kHz. Press
LC Dip Adjustments
AlOdB and A20dB Adjustments
DB Bandwidth Adjustments
DB Bandwidth Adjustments
45. Location of 3 dB Bandwidth Adjustments
DB Bandwidth Adjustments
Step Gain and 18.4 MHz Local Oscillator Adjustments
Step Gain and 18.4 MHz Local Oscillator Adjustments
Step Gain and 18.4 MHz Local Oscillator Adjustments Setup
If Gain Adjustment
47. Location of if Gain Adjustment
DB Gain Step Adjustment
48. Location of 10 dB Gain Step Adjustments
MHz Local Oscillator Adjustment
+ 1OV Temperature Compensation Supply Adjustment
Key in Frequency Span 1kHz, REs 100 Hz,
Converter Adjustments
Down/Up
Down/Up Converter Adjustments
Optional
Down Converter Gain Adjustment
52. Time Base Adjustment Setup
Cables
Procedure Note
Set the Frequency Counter controls as follows
53. Location of A27Al Adjustment
Time Base Adjustment SN 2848A to 3217A05567
Time Base Adjustment SN 2848A to 3217A05567
X10
Math SELECT/ENTER Cm 10 I-1 6 SELECT/E~&ER
55. Location of A27A2 Adjustment
Reference Adjustments
MHz Reference Adjustments
13 MHz
Type N m to BNC f Type N f to BNC f
57. Location of 20 MHz Reference Adjustments
Delay 40ns
1V / div
Offset Coupling
1Ol
58. Typical Signal at A16TP3
Press &K?@ Press CnTavj
MHz Phase Lock Oscillator Adjustments
MHz Phase Lock Oscillator Adjustments
Reference Description
Type N m to BNC f
Location of 249 MHz Phase Lock Oscillator Adjustments
Single
Page
MHz Phase Lock Oscillator Adjustment
Disconnect test equipment from instrument
Second if Amplifier and Third Converter Adjustment
63. Second if Amplifier Adjustments Setup
Second if Amplifier and Third Converter Adjustment Adapters
Second if Amplifier Adjustments
BNC to SMB Snap-On Service Accessory 2 required
Second if Amplifier and Third Converter Adjustment
Third Converter Adjustment
66. Minimum Image Response at 258.4 MHz
Type N m to BNC f 2 required Type N f to BNC f 2 required
Pilot Second if Amplif’ier Adjustments
1250-1745 1250-0780 1250-1474 1250-1749
Pilot Second if Amplifier Adjustments
Location of 269 MHz Bandpass Filter Adjustments
MHz Bandpass Filter Adjustments Waveforms
Frequency Control Adjustments
Frequency Control Adjustments
HP 3456A
Slow Sweep Adjustment
Start-Up Time
Full Sweep Adjustment
YTO and VT0 DAC Adjustments
Start and Stop Adjustments
Key in ml CF Step Size J 1023 Hz
Second Converter Adjustments
Second Converter Adjustments
Reference Related Performance
S t
Second LO Frequency and Shift Adjustments
Set HP 8568B Spectrum Analyzer Line to on and press
Second Converter Adjustments
Second Converter Bandpass Filter Adjustments
74. Typical Pilot 2ND if Bandpass Shift t
1i i i i ii i
Second Converter Final Adjustments
Voltage-Tuned Oscillator Adjustments
78 MHz Voltage-Tuned Oscillator Adjustments Setup
MHz Voltage-Tuned Oscillator Adjustments
Dacs Accuracy Check Positive Supply Adjustment
Connect DVM to AllTPl located on All cover
VT0
Center-Frequency Checks
Slope Compensation Adjustments
Slope Compensation Adjustments
SMA m m
Leveling EXT Input
81. Location of A22R66 Tiiit Adjustment
Comb Generator Adjustments
83. Location of Comb Generator Adjustments
Comb Generator Adjustments
84. Comb Teeth Display
Comb Generator Adjustments
Analog-To-Digital Converter Adjustments
85. Analog-To-Digital Converter Adjustments Setup
Location of Analog-To-Digital Converter Adjustments
Press Qnstr Preset
Procedure
Equipment
Digital Voltmeter DVM
Place instrument upright as shown in -87 with top and A3
Track and Hold Adjustments
88. Location of Track and Hold Adjustments
Track and Hold Adjustments
Digital Storage Display Adjustments
Reference Description Equipment Procedure
Preliminary Graticule Adjustments
Digital Storage Display Adjustments
90. Location of Digital Storage Display Adjustments
Sample and Hold Balance Adjustments
91. Sample and Hold Balance Adjustment Waveforms
Y Offset and 25. Gain Adjustments
Final Graticule Adjustments Y Expand Adjustments
Low-Noise DC SUPPlY
Crystal Filter Bypass Network Configuration
Crystal Filter Bypass Network Configuration
Option
Impulse Bandwidths
Description Equipment Procedure
DB Resolution Bandwidth Accuracy Test
Related Adjustment Specification
Page
Impulse and Resolution Bandwidth Accuracy Test
Page
Impulse and Resolution Bandwidth Accuracy Test
Page
100 kHz MHz 30 kHz
10 kHz 100 kHz KHz
900 kHz MHz
90 kHz 110 kHz
1Frequency
MHz 300 kHz
KHz 300 Hz
100 Hz 150 Hz 30 Hz
DB Resolution Bandwidth Selectivity Test
Press
DB Bandwidth Measurement
60 dB
VlDEoj
MHz 20 MHz 100 Hz 11l 15 MHz 300 Hz 300 kHz
Page
Impulse and Resolution Bandwidth Selectivity Test
Selectivity Frequency ‘EG Bandwidth DB BW Ratio Span
Procedure 1. Press ~NSTR Preset
Press LOG Enter dB/otv and key in 1 dB. Press Marker
LdB’ t-H+
MHz 500 kHz 50 kHz 10 kHz KHz KHz 200 Hz 100 Hz
‘RES
Steps 1 through 38. Impulse Bandwidth Accuracy
Option
MHz 20 MHz 100 Hz 11l 15 MHz 300 Hz 111 300 kHz
MHz 100 Hz 11l 300 Hz 300 kHz
Ref. xt 1.0 It Zt 0.5 xt F 0.5 f 0.5 f 0.5 f 0.8 f
DB Resolution Bandwidth Adjustments
Test
Location of Bandwidth Adjustments
DB Resolution Bandwidth Adjustments
Impulse Bandwidth Adjustments
C O N T R O L
Key in @E’GZT 3 kHz, Frequency Span 5 kHz, Peak SEARCH,
Introduction
Specification Log
Related Adjustment Log Amplifier Adjustments
Option 857 Amplitude Fidelity Test
+ 10 dBm
Frequency
Sk1.0 dB %1.5 dB
Marker a
Performance Test Record
Test 12. Option Amplitude Fidelity Test
DB sf1.5 dB
Min Max
6-5
6-5 6-6
RF Section Figure Index
Major Assembly and Component locations
RF Section, Top View
RF Section, Front View
RF Section, Bottom View
\.\ \ I ‘i
If Section, Top View SN 3004A and Above
If Section, Front View
W2g