High Resolution Raster Plot Syntax
The proper command syntax for high resolution graphics is:
1)Even dot center control sequence . . . plot data . . . line terminator followed by:
2)Odd dot center control sequence . . . plot data . . . line terminator
For Example,
EOT (data) LF
ENQ (data) LF
NOTE: When plotting even dot centers using EOT, ESC Y (line feed and form feed commands denote end of plot data only), the paper will not advance. When plotting odd dot centers (ENQ, ESC Z), line feed and form feed control character denote end of plot data, and paper will advance to the next plot line or to
Scaling Graphics
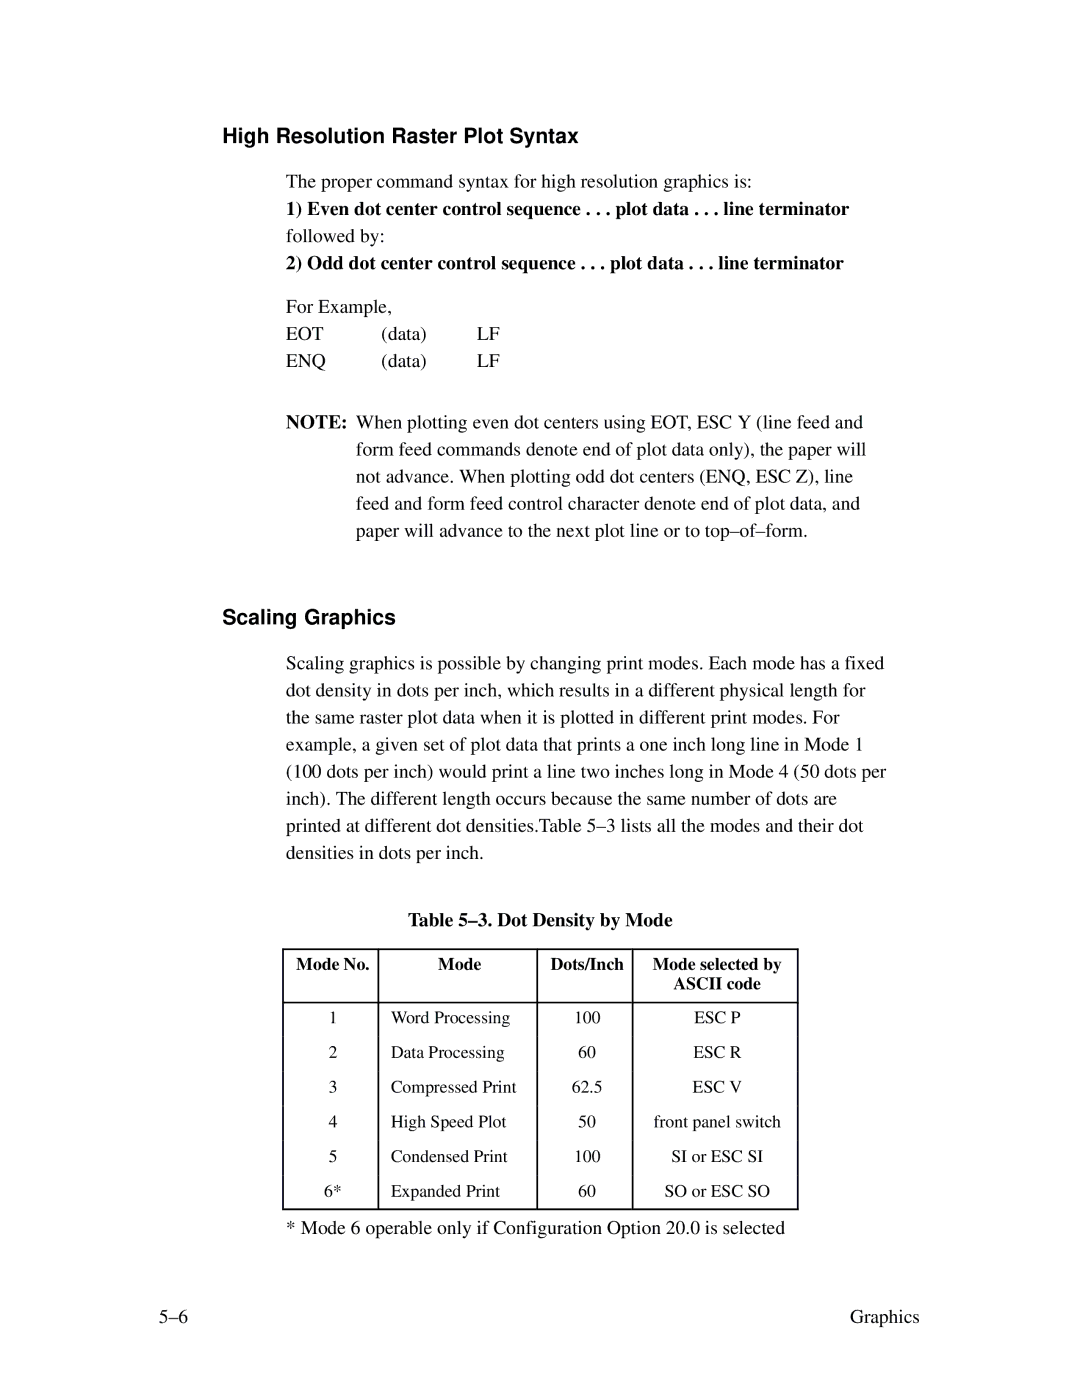
Scaling graphics is possible by changing print modes. Each mode has a fixed dot density in dots per inch, which results in a different physical length for the same raster plot data when it is plotted in different print modes. For example, a given set of plot data that prints a one inch long line in Mode 1 (100 dots per inch) would print a line two inches long in Mode 4 (50 dots per inch). The different length occurs because the same number of dots are printed at different dot densities.Table
Table 5–3. Dot Density by Mode
Mode No. | Mode | Dots/Inch | Mode selected by | |
|
|
|
| ASCII code |
|
|
|
|
|
1 | Word Processing | 100 |
| ESC P |
| Data Processing | 60 |
| ESC R |
2 |
| |||
|
|
|
|
|
3 | Compressed Print | 62.5 |
| ESC V |
|
|
|
|
|
4 | High Speed Plot | 50 |
| front panel switch |
|
|
|
|
|
5 | Condensed Print | 100 |
| SI or ESC SI |
|
|
|
|
|
6* | Expanded Print | 60 |
| SO or ESC SO |
|
|
|
|
|
* Mode 6 operable only if Configuration Option 20.0 is selected
Graphics |