Double Density Plot
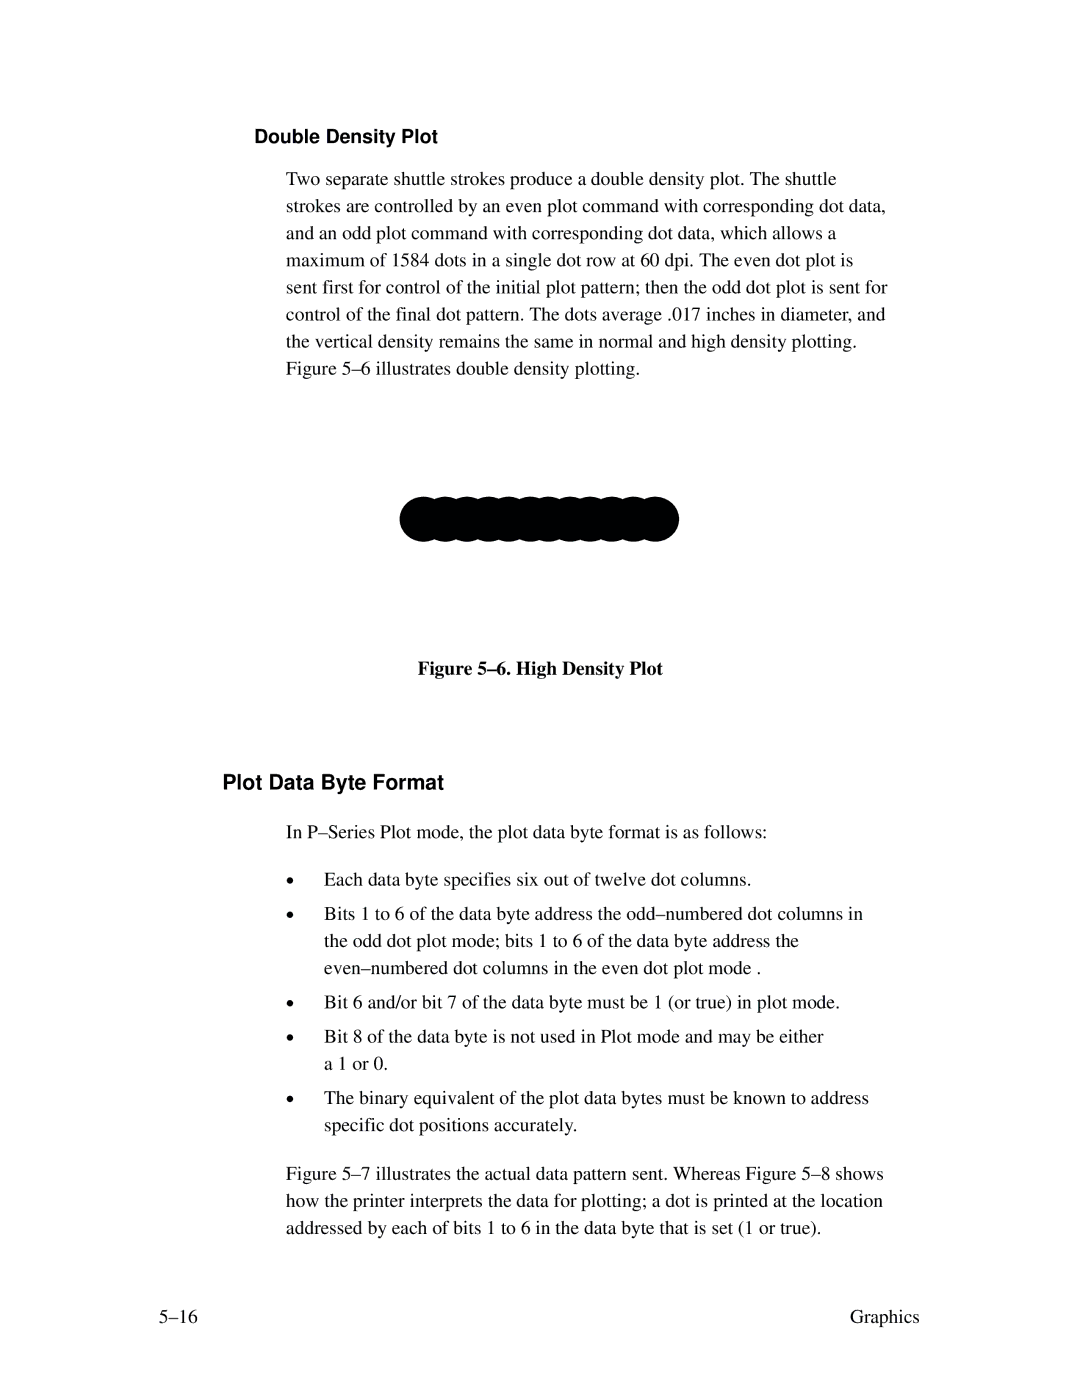
Two separate shuttle strokes produce a double density plot. The shuttle strokes are controlled by an even plot command with corresponding dot data, and an odd plot command with corresponding dot data, which allows a maximum of 1584 dots in a single dot row at 60 dpi. The even dot plot is sent first for control of the initial plot pattern; then the odd dot plot is sent for control of the final dot pattern. The dots average .017 inches in diameter, and the vertical density remains the same in normal and high density plotting. Figure
Figure 5–6. High Density Plot
Plot Data Byte Format
In
•Each data byte specifies six out of twelve dot columns.
•Bits 1 to 6 of the data byte address the
•Bit 6 and/or bit 7 of the data byte must be 1 (or true) in plot mode.
•Bit 8 of the data byte is not used in Plot mode and may be either a 1 or 0.
•The binary equivalent of the plot data bytes must be known to address specific dot positions accurately.
Figure 5–7 illustrates the actual data pattern sent. Whereas Figure 5–8 shows how the printer interprets the data for plotting; a dot is printed at the location addressed by each of bits 1 to 6 in the data byte that is set (1 or true).
Graphics |