Programming Example with Odd Dot Plot
The following program uses the Odd Dot Plot control code to produce the image in Figure
10 LPRINT “Odd Dot Plot”
20 FOR I=1 TO 8
30 READ R1
40 READ R2
50 LPRINT CHR$(5);
60 FOR N=1 TO 25
70 LPRINT CHR$(R1);CHR$(R2);
80 NEXT N
90LPRINT
100NEXT I
110DATA 42, 64, 73, 65, 92, 64, 42, 64, 73, 65, 92, 64, 42, 64, 73, 65
120LPRINT
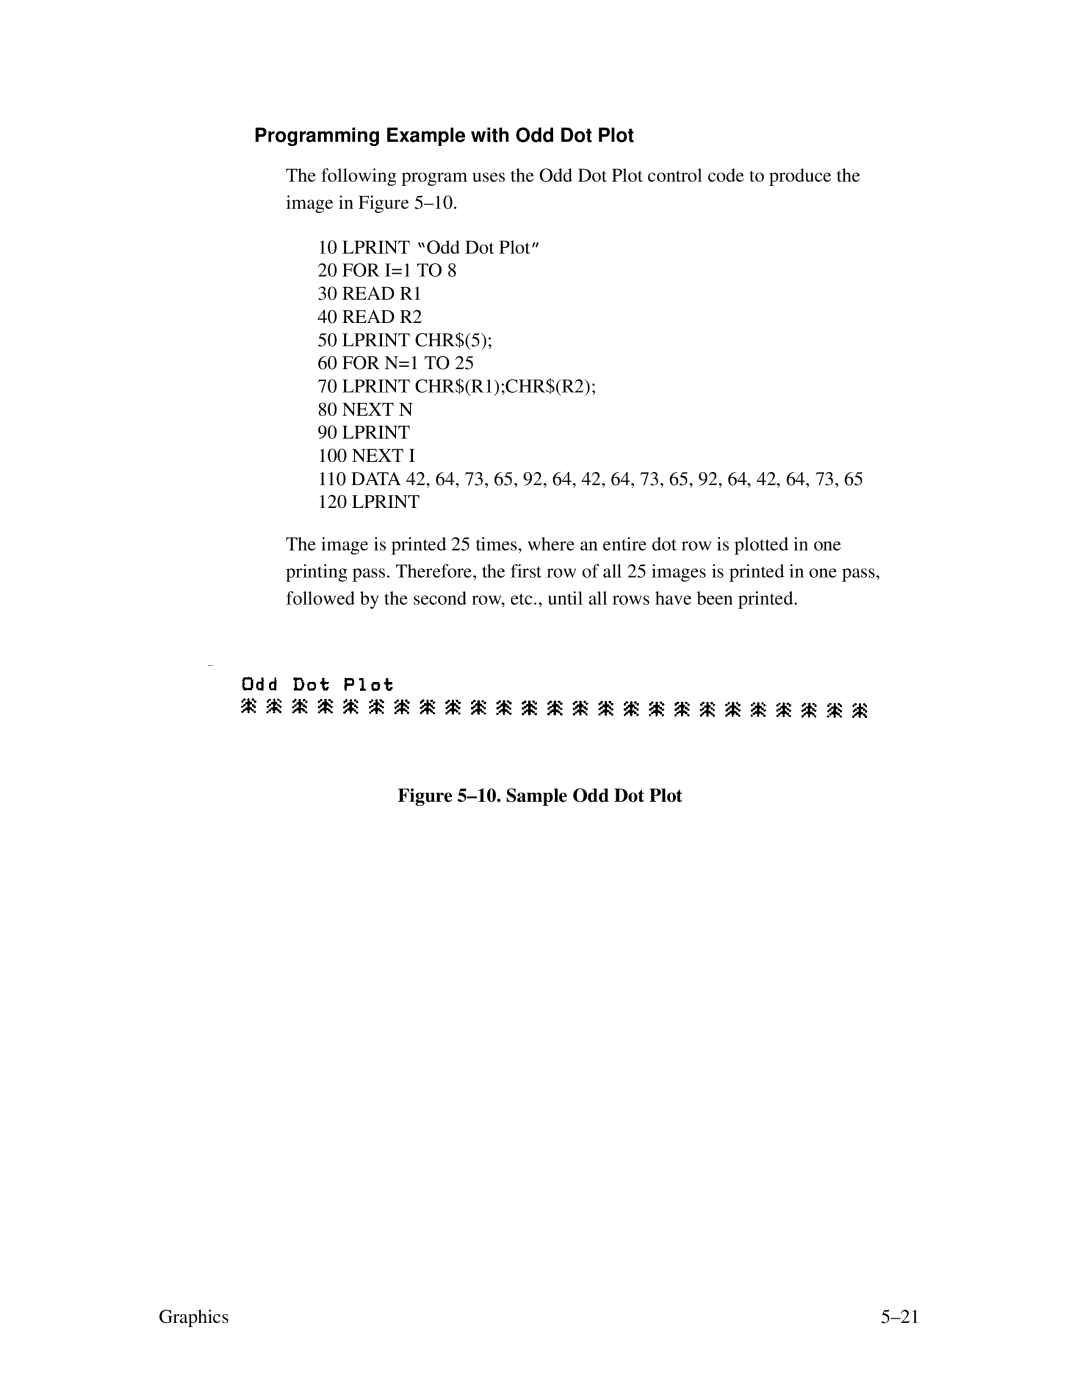
The image is printed 25 times, where an entire dot row is plotted in one printing pass. Therefore, the first row of all 25 images is printed in one pass, followed by the second row, etc., until all rows have been printed.
Figure 5–10. Sample Odd Dot Plot
Graphics |