Appendix D: Acceptance Test Procedures
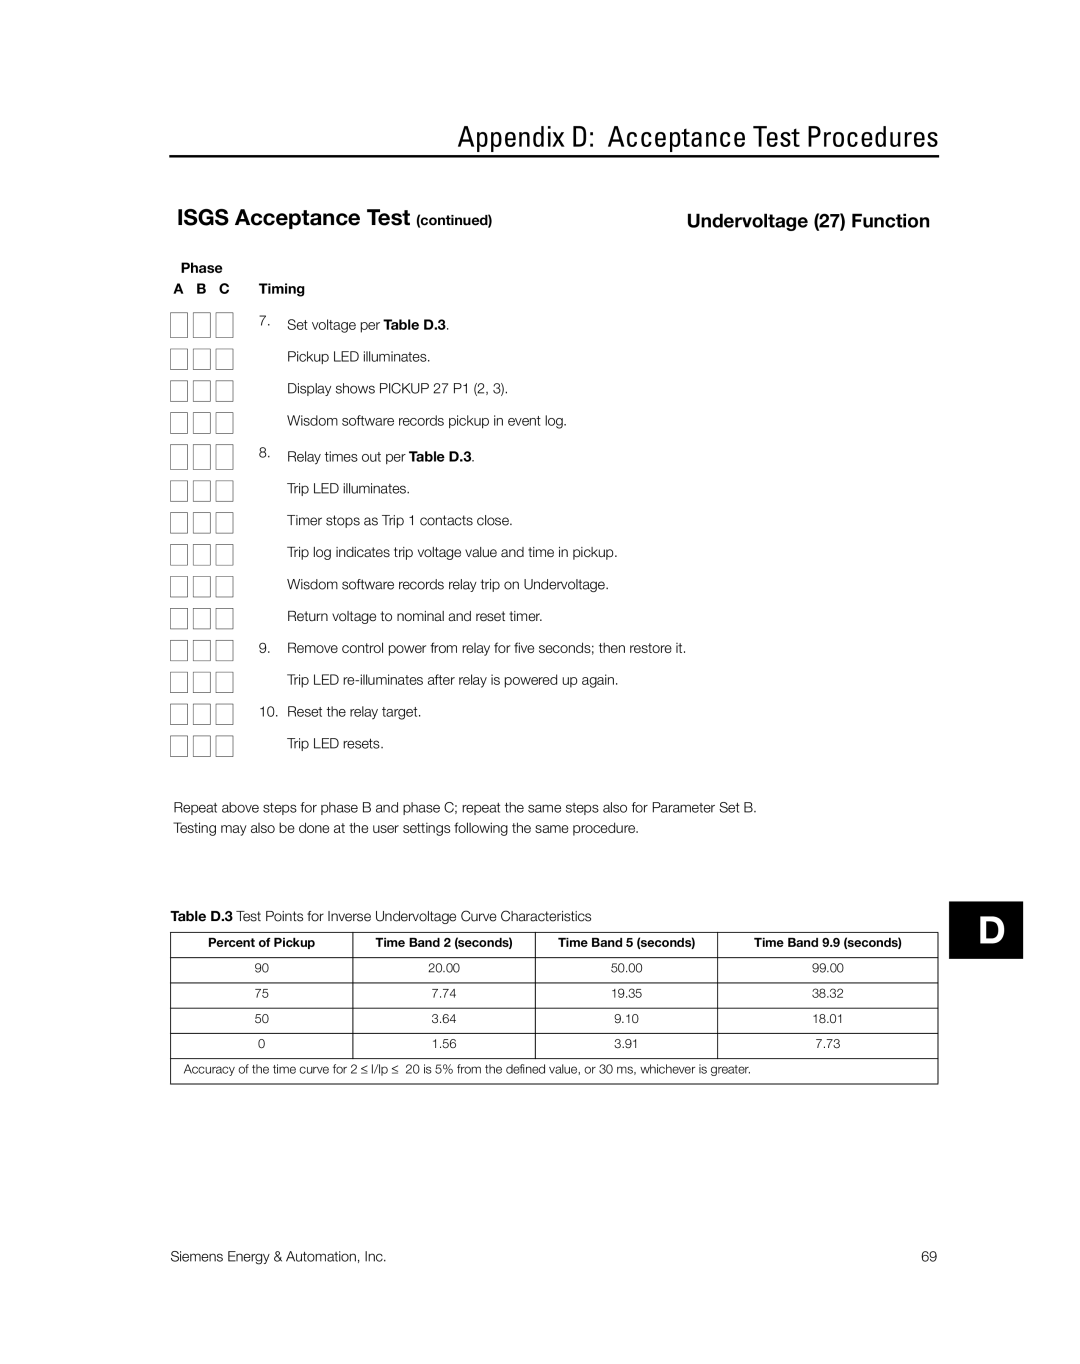
ISGS Acceptance Test (continued) | Undervoltage (27) Function | ||||||
Phase |
|
|
| ||||
A B C | Timing |
| |||||
|
|
|
|
| 7. | Set voltage per Table D.3. |
|
|
|
|
|
|
| ||
|
|
|
|
|
|
| |
|
|
|
|
|
| Pickup LED illuminates. |
|
|
|
|
|
|
|
| |
|
|
|
|
|
| Display shows PICKUP 27 P1 (2, 3). |
|
|
|
|
|
|
| Wisdom software records pickup in event log. |
|
|
|
|
|
| 8. | Relay times out per Table D.3. |
|
|
|
|
|
|
| ||
|
|
|
|
|
|
| |
|
|
|
|
|
| Trip LED illuminates. |
|
|
|
|
|
|
|
| |
|
|
|
|
|
| Timer stops as Trip 1 contacts close. |
|
|
|
|
|
|
| Trip log indicates trip voltage value and time in pickup. |
|
|
|
|
|
|
| Wisdom software records relay trip on Undervoltage. |
|
|
|
|
|
|
| Return voltage to nominal and reset timer. |
|
|
|
|
|
| 9. | Remove control power from relay for five seconds; then restore it. |
|
|
|
|
|
|
| Trip LED |
|
|
|
|
|
|
|
|
|
|
|
|
|
| 10. | Reset the relay target. |
|
|
|
|
|
|
| Trip LED resets. |
|
|
|
|
|
|
|
| |
Repeat above steps for phase B and phase C; repeat the same steps also for Parameter Set B. Testing may also be done at the user settings following the same procedure.
Table D.3 Test Points for Inverse Undervoltage Curve Characteristics
Percent of Pickup | Time Band 2 (seconds) | Time Band 5 (seconds) | Time Band 9.9 (seconds) |
|
|
|
|
90 | 20.00 | 50.00 | 99.00 |
|
|
|
|
75 | 7.74 | 19.35 | 38.32 |
|
|
|
|
50 | 3.64 | 9.10 | 18.01 |
|
|
|
|
0 | 1.56 | 3.91 | 7.73 |
|
|
|
|
Accuracy of the time curve for 2 ≤ I/Ip ≤ 20 is 5% from the defined value, or 30 ms, whichever is greater.
D
Siemens Energy & Automation, Inc. | 69 |