Rev 4 5-JAN-2013
BX HVAC, and CX Convenience Store Controllers
Page
E2 Firmware Version
Page
Table of Contents
Product Temperature Probes Humidity Sensors and Humidistats
Inside Temperature Sensor
Outside Temperature Sensor
Insertion Temperature Probe
1 I/O Board Names and Terminology MultiFlex-Plus + Board
Board Installation
Plug-In Digital I/O Network Card P/N
Plug-InFour-Channel Internal Repeater
Power Connection Input Setup in E2
Powering Echelon Devices
Configuring Echelon Devices
Connecting Sensors to Input Boards
Specifying Alarm Reporting Types
Setting the Time and Date 10-9 10.9
Changing Required User Access Levels
Web Services
Clean and Door Switches 11-7
Priority Settings
Using and Configuring a Setup Screen
Using the Help Key to get Property Help
Setting Up An Individual Case Controller
11.4.9 Clean/Wash Mode
11.4.11 Fail-Safe Mode
11.4.12 Wiring
11.7.2 How Zones Work
11.7.4 Temperature Control
11.7.5 Zone Temperature
11.7.7 Economization Enable
Alarms
Setpoint Reset
Temperature Differential TD Strategy
Configuration
Accessing the Alarm Advisory Log
Service Modes
11.21.12 Configuration
Learning Mode
12.10.2 Viewing the Controller Advisory Log
12.10.5 Ack/Reset State
12.10.8 Acknowledging, Resetting, and Clearing Log Entries
12.10.9 Facility Status Display FSD Alarms
Page
E2 Refrigeration Controller RX
Introduction
E2 Building Controller BX
E2 Convenience Store Controller CX
1 E2 I/O Network
Networking Overview
Interconnection With Other E2s
E2 Echelon Lonworks Network
Documentation Overview
Software Licensing
On-Line Help System Overview
Page
E2 Hardware
Hardware Overview
PIB LED’s Status
1 E2 Main Processor Board 3 E2 Keypad
LEDs
PIB LEDs Status
Keyboard Status
I/O Network Boards and Peripherals
Gateway Board
Main Board Status CPU LEDs
Gateway Model
MultiFlex Boards
MultiFlex 16 Input Board
MultiFlex Combination Input/ Output Boards
MultiFlex Combination Input/Output Board Top View
Model Description Name
MultiFlex PAK Board
MultiFlex CUB
MultiFlex RTU BX and CX Only
MultiFlex Rooftop Control Board RCB BX and CX Only
Hand-held Terminal P/N
MultiFlex ESR Board
RJ-11 to male RJ-11 cable
8RO and 8ROSMT Relay Boards
15- 4AO Analog Output Board P/N
6 4AO Analog Output Board
8ROe Dis
16AIe Dis
EC-2s
Facility Status Display FSD
5 TD3 Temperature Display
Recessed Mount
Mounting
Mounting the E2
Standard Mount
Standard Mount Inside Rear of Enclosure
Retrofit Mounting
Mounting I/O Boards
Blank Face
Single/Double Enclosures
4AO Board
Boards Without Enclosures Snap Track
3 TD3
Echelon Devices
COM3 Internal Modem Plug-In Card P/N
MultiFlex ESR
Mounting the Four-Channel Repeater
Two-Channel and Four- Channel Repeaters
Mounting Repeaters Overview
Mounting the Two-Channel Repeater
Pressure Transducers
Inside Temperature Sensor
Outside Temperature Sensor
Sensors Transducers
Application Sensor Type
Insertion Temperature Probe
Supply and Return Air Sensors
Mounting Bullet and Pipe Mount Sensors
Outdoor RH Sensors
Product Temperature Probes
Humidity Sensors and Humidistats
Indoor RH Sensor
Dewpoint Probe
Light Level Sensor
Duct-mounted Insertion RH Probe
Refrigerant Leak Detectors
Liquid Level Sensors
Page
Enclosure
E2 Hardware Setup
Setting up the E2
Main Processor Board
Add-On E2 Peripherals
Powering the E2
3 COM3 Internal Modem Plug- In Card P/N
Plug-In Digital I/O Network Card P/N
LEDs
E2 Installation Guide
Pre-Sets
Serial Device Software Setup
Overview
COM Ports
E2COM# Associations Connector
Page
Page
Or I/O Net
RS485 Network and Hardware Setup
I/O Network
1 I/O Board Names and Terminology
Board Designation
Wiring Types
MultiFlex-Plus + Board
I/O Network Structure Daisy Chains
Setting the Baud Rate
Network Noise Minimization
Network ID Numbers Board Numbers
Powering the I/O Boards
Setting the Terminating and Biasing Jumpers
Wiring Types
14 AWG
Board Installation
IMC/Prodigy Rooftop Unit Controllers
Control Techniques Drive
3.1 XR75CX-Case Display
3 XR35CX, XR75CX, XEV22 Case Controllers
IPro DAC
Energy Meter
Supported System Types
Copeland Discus with CoreSense Protection
Advisory and Alarms
Light Commercial Thermostat
Thermostat Inputs
Comfort Alert Descriptions Cause E2 Advisory
Conditions for Return to Normal RTN on Diag- nostic Codes
High/Low Occ/Unocc Space Temperature Alarms
Supply Sensor Fail Alarm
Refrigerant Leak Detection System Rlds
12.2 XM679
Diagnostic Alarms
XM Series of Case Controllers
12.1 XM670
Master Slave Token Passing
BACnet
BACnet Overview
BACnet Communication
Client-Server
3 MS/TP Network Connection To E2
BACnet IP Internet Protocol
Discovery
13- Commissioning Screen
Rescan
16 E2 RX/BX/CX I&O Manual Rev 4 5-JAN-2013
Multiflex Combination I/O Board Installation Guide
18 E2 RX/BX/CX I&O Manual Rev 4 5-JAN-2013
BACnet
20 E2 RX/BX/CX I&O Manual Rev 4 5-JAN-2013
16AI Installation Guide
MultiFlex ESR Installation Guide
BACnet
24 E2 RX/BX/CX I&O Manual Rev 4 5-JAN-2013
Page
Page
E2 Ethernet Peer Communications
Ethernet IP Configurations
Hardware Specifications
Equipment Type Specifications
Closed Network Layout
Ethernet Network Layouts
Open Network Layout
Open Network Layout
Peer Network Tab Set Group Name
Troubleshooting
Cable Type Emerson Retail Solutions Part Number
Echelon Network and Hardware Setup
Wiring Type
Echelon Network Cable Specifications
Maximum Number of Echelon Devices
Device Termination
Maximum Total Segment Length
Wire Restrictions
Installing Echelon Devices
Powering Echelon Devices
LEDs
Configuring Echelon Devices
Echelon Board Status Red D1 Reset
Red Service
Connected/IO Setup Screen RX Unit Shown
Troubleshooting
E2 RX/BX/CX I&O Manual Rev 4 5-JAN-2013
One pin when unterminating an
E2 RX/BX/CX I&O Manual Rev 4 5-JAN-2013
Input Type Dip Switches
Input and Output Setup
Wiring
Sensor Wiring Types
Input Type Dip Switches for MultiFlex 16 and 16AI Boards
Power Connection
Down
Sensor Input Type Wiring Dip Switch
Wall-mounted Down
Level
Down
Input Setup in E2
Association
Using the Input Definitions/ Status Screen
Setting Up Analog Inputs
Application
Per Pulse on
Sensor Type Description
Digital Input Screen
Setting Up Digital Inputs
Wiring Form C Contacts
8RO, 8IO, and MultiFlex Outputs
MultiFlex Relay Outputs
Board Type Version
Setting the Fail-Safe Dip Switch
Relay Output Test Mode
Output Board Fail-Safe and Switch Settings
Old 8ROs
Wiring Outputs to Points
Output Setup in E2
Output LED
Setting Up Digital Outputs
Using the Output Definitions/ Status Screen
12- Digital Output Screen
Setting Up Analog Outputs
13- Analog Output Screen
Inputs
CC-100 Case Controllers
Power Module Wiring
Valve Cable
335-3263 Pulse Valve
MultiFlex ESR Board
CCB Case Controllers
335-3260 to Valve Connection Information
ESR8 Boards Dis
ESR8 and MultiFlex ESR Valve Output Wiring
Page
Logging On
Cleaning Out the Controller
Performing a Clean Out
Quick Start
Setting Number of Network Devices
Boards on the I/O Network
Unit Controllers Echelon
Customizing the Home Screen
Setting Number of Applications
Help Line
Common Screen Elements
Header
Function Keys
Key Function for RX
Screen Types
Main Menu
Status Screens
Actions Menu Options and Descriptions
Setup Screens
Actions Menu
Actions Menu Item Description
System Configuration Menu
System Configuration Menu Options
Menu Option Description
System Information Menu Options
System Information Menu
Setting the Time and Date
Time/Date Setup
Set Up Modem
17- TCP/IP Addressing
Set Up TCP/IP
Set Up Network Baud Rates
10.11.1 COM1 Serial RS232 Baud Rate
10.11.2 I/O Network Baud Rate
Set Up User Access
User Access Levels
Level
Changing Required User Access Levels
Creating a New User Account
Deleting a User
Set Up I/O Network
Specify Number of Boards
Checking Online Status
Set Up Echelon Network
Specifying Number Devices
Commissioning a Device
Network Commissioning
Service Button Method
How Echelon Commissioning Works
Modbus Commissioning
Manual ID Entry Method
CC-100’s Service Button
TD3’s Service Button
ESR8’s Service Button
31- Commissioning Menu
License Management
Web Services
Set Up Alarming
Display Line
Specifying Alarm Reporting Types
Alarm Output
Echelon Network Alarm Annunciator
Setting up an E2 to be an Alarm Annunciator
Alarm Dial-Out
Set Alarm Annunc field to Yes
Introduction Alarm Reporting
Set Up Global Data
10-24 E2 RX/BX/CX I&O Manual Rev 4 5-JAN-2013
Priority Settings
Example Setting Up an Outdoor Temperature Sen- sor
Set Up Applications
Delete an Application
Using and Configuring a Setup Screen
10.18.1 Add/Delete an Application
Add an Application
Navigating the Setup Screen
Edit Menu
Entering Setpoints
Help Line
Function Keys For Setup
Function Keys for Setup Screens
Index Tabs
Using the Help Key to get Property Help
Page
Standard Suction Group Application
Software Overview
Suction Groups
Introduction
Control/Cycles Parameter
Learning Mode
Hardware Overview
Circuit Load Analysis
Air Cooled Condensers
Temperature Differential Strategy
Input Sensor Type Wiring Instructions
Condenser Control
Fan Control
Condenser Split Mode
Fast Recovery
Evaporative Condensers
Evaporative Condenser
Standard Circuits
Defrost Control
Refrigeration Control
Emergency Defrost
Clean and Door Switches
Clean Switches
Defrost Termination
Control Link CD Case Display
TD3 Temperature Display
Wiring
Door Switches
Typical Case in a Standard Circuit
Overview
Case Control Circuits
EEVs Liquid Pulse and Liquid Stepper
Valve Control
EEPRs Suction Stepper
Thermostatic Expansion Valves TXVs
Off Cycle Timed
Wait State
Temperature Termination
Anti-Sweat Control
Demand Defrost
Dewpoint Input Sources
Clean/Wash Mode
Dual Temp Control
Light Control
Fail-Safe Mode
Recoverable Sensor Failures
Walk-In Freezer Control
Logging Groups
Setting Up An Individual Case Controller
Clipping
Possible Data Errors
Data Compression
Base Log Group
Logging Setup Menu
Setting Up Logging
Application Log Report
Logging Group Status Screen
Log Reports
Logging Group Report
System Log Report
Temperature Control
Air Handling Units
Alternate Setpoints
Single-Speed Fans
Two-Speed Fans
Variable-Speed Fans
Dehumidification Control
Economizer Control
Digital Economizer Control
Analog Economizer Control
Curtailment
Optimum Start/Stop OSS
Intelligent Pre-Starts and Pre-Stops
AHU Zone Control
Separate Setpoints
11- Suction Group Outputs
Output Device Wire 8RO contacts Set Fail-safe Dip Switch to
Zone Control
How Zones Work
MultiFlex RCB-P Board
Applications That May Be Connected To Zones
MultiFlex RTU Board
MultiFlex RCB Board
Zone Temperature
Economization Enable
AHUs
Effect of Enabling Economization
Zone Humidity Input Effect of Enabling Dehumidification
MultiFlex RTUs and RCBs
17- Diagram of Pre-Start and Pre-Stop Operation
MultiFlex RTU/ARTC and AHU Zone Association
MultiFlex CUB Board
Losing Contact With Zone Applications
Stand-Alone MultiFlex RTUs
Lighting Schedules
MultiFlex PAK Board
Light Level Interface Cell
Functions of the Lighting Schedule Application
Control Method Select
Standard Control
Alternate Control
Schedule Interface Cell
Multi-Logic Combiner
Offset Solar Control
Basic Schedule Cell
Min ON/OFF Cell
Proof Cell
Demand Monitoring
Demand Control
Output Light Dimming
Introduction to Demand Limit Control
Definition
Load Shedding
Shedding Levels
Priority Levels
Rotational Shed
Last Shed
Other Notes About Priority Levels
Mode 1 KW Input Is Greater Than Setpoint
Mode 3 Integral Error Approaching Zero
How Demand Control Uses Load Shedding
Analog Sensor Control
Power Monitoring Input
Settings
Sensor Control
Digital Sensor Control
Logical Combination
Control Cells
Select Cell
Diagram
Loop/Sequence Control Cell Descriptions
Output Cells
Output Cell Descriptions
Events
Time Scheduling and Holidays
How Schedules Work
PWM Cell
Overlapping
Power Monitoring
Holiday Schedules
Temporary Schedule Events
Monthly
Logging
Hourly
Daily
Anti-Sweat Setup
Heat/Cool Control
How Anti-Sweat Works
Unoccupied Hysteresis
Setpoint Reset
Lead/Lag
Analog and Digital Combiners
TD Control Fail-Safes
Temperature Differential TD Strategy
Configuration
TD Control
Alarms
Pulse Accumulation
Outputs
Zones and Cycles
Accumulator Reset Types
Irrigation Control
High Trip
Cycle Scheduling
Zone Inhibit
Zone Bypass Inputs
Service Modes
Flow Sensor-Related Tests
Two Speed Fan Control
Modular Chiller Control MCC
Flexible Combiner
Compressor Control
Learning Mode
Variable Frequency Drive Compressor
Boiler
Bypass Valve Control
Digital Scroll Compressor
Device Constraints
RMS Asset
RMS Scale
Log Information
Unlogged Changes
Logged Changes
Page
Page
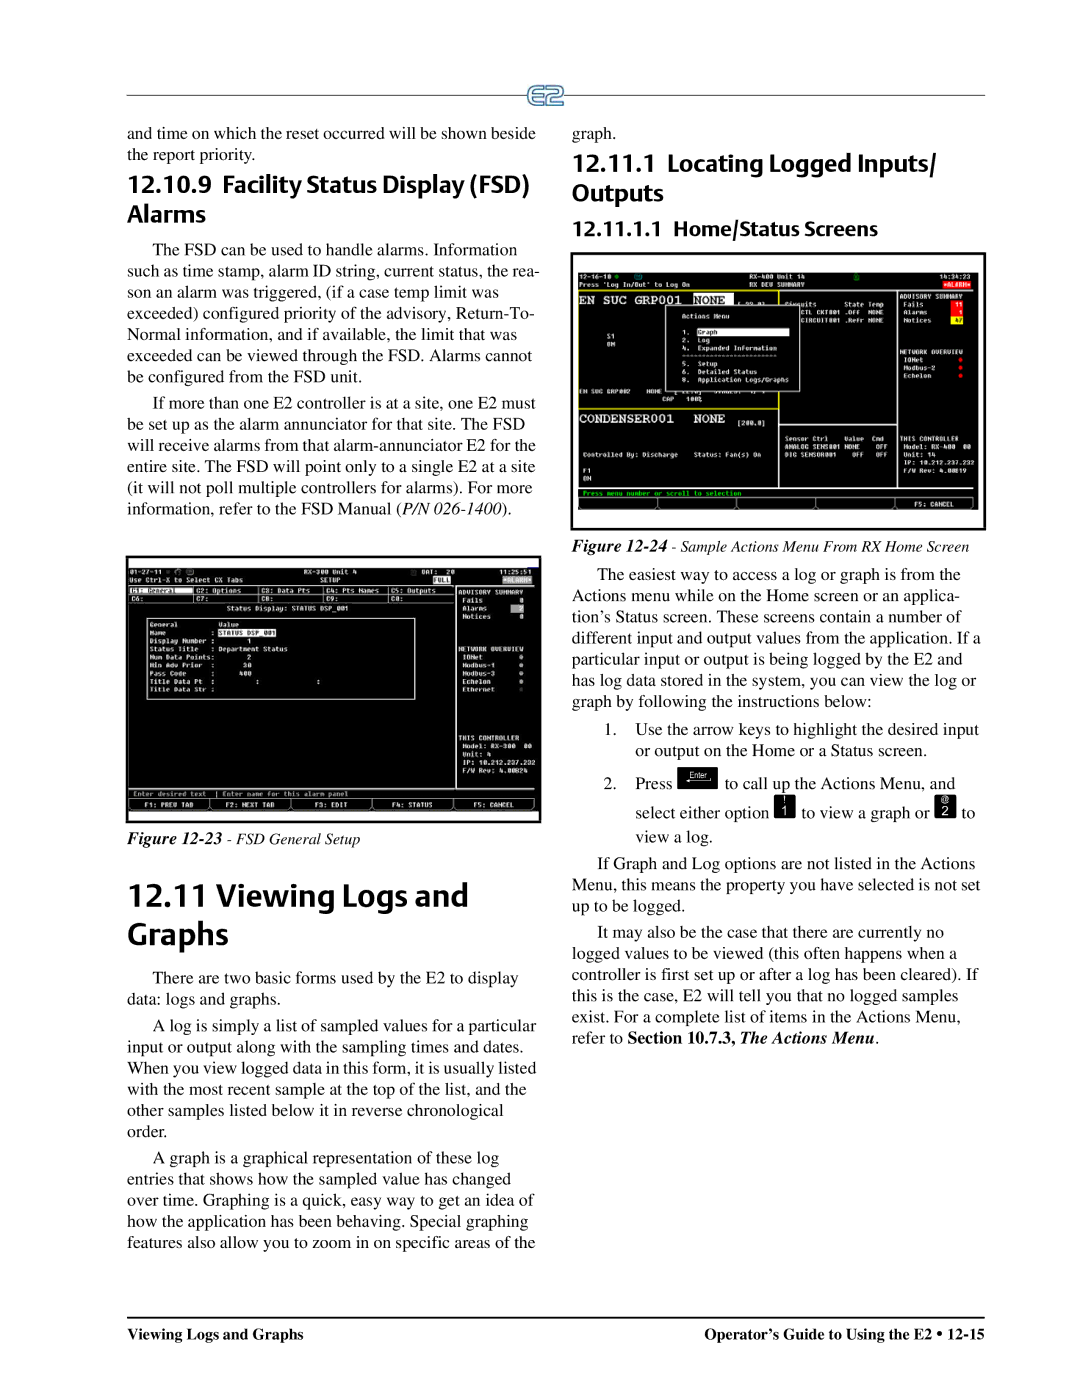
RX Home Screen
Operator’s Guide to Using the E2
E2 Home Screen
BX Home Screen
CX Home Screen
Logging On and Access Levels
Menus
System Configuration Menu
Toggling Full Options
Navigation
System Information Menu
Press System Configuration Press System Information
Status Screens
Screen Types
Actions Menu
Summary Screens
Setup Screens
Index Tabs
Header Icons
Enter Key
E2 Keypad
Cursor
Tab Key
Ctrl Page Up/Ctrl Page Down Keys
Log In/Out Key
Four Directional Arrow Keys
Up/Page Down Keys
Customizing the Home Screen
Manual Defrost and Clean Mode
Overrides
List menu and choose End Manual Mode
Checking Boards Online Checking Status Screens
Date and Time
Alarms
Accessing the Alarm Advi Sory Log
Viewing the Controller Advisory Log
Advisory Message
12.10.5 Ack/Reset State
Alarm States
Area Ctrl Application Property
Clearing
Resetting
Home/Status Screens
Facility Status Display FSD Alarms
Viewing Logs and Graphs
Locating Logged Inputs Outputs
Setup Screens
Setting Up Input and Output Pointers
Log View
Zooming In and Out
Graph View
Multiple Languages
Appendix a Case Type Defaults
High Alarm, Low Alarm, and Delay
Defrost Type
Hdbx
100 lb 200 lb 500 lb Xducer
Table B-1- Temp Sensor Temperature/Resistance Chart
Table B-2- Eclipse Voltage to Pressure Chart
Eclipse Transducers Voltage Pressure PSI
Page
Alarm Name Default Definition Priority
Appendix C Alarm Advisory Messages
E2 RX/BX/CX I&O Manual Rev 4 5-JAN-2013
Appendix C Alarm Advisory Messages C-3
Alarm Name Default Definition Priority
Appendix C Alarm Advisory Messages C-5
Alarm Name Default Definition Priority
Appendix C Alarm Advisory Messages C-7
Alarm Name Default Definition Priority
Appendix C Alarm Advisory Messages C-9
10 E2 RX/BX/CX I&O Manual Rev 4 5-JAN-2013
Appendix C Alarm Advisory Messages C-11
12 E2 RX/BX/CX I&O Manual Rev 4 5-JAN-2013
RAM
14 E2 RX/BX/CX I&O Manual Rev 4 5-JAN-2013
ISD 2.0/2.1 CoreSense Diagnostics
Copeland CoreSense E2 Alarms
No 3PHASE PWR
Performance Alert CoreSense Diagnostics
CoreSense Device
Other Advisories
Discus P470 CoreSense Protection
K5 Ref Scroll P510 Copeland Scroll
CoreSense CommP47 CoreSense Comm
Proportional P Mode
Appendix D PID Control
Throttling Range
Throttling Range on page D-1
Integral Mode
Why I Mode is Necessary
Proportional Constant Kp
Derivative Mode
I Mode Calculation
Saturation
Output at Setpoint for Non-Condenser
D Mode Calculation
How Condenser Control Hvac PID Differs From Others
Output at Setpoint
Output at Setpoint for Condenser/HVAC PID Control
Other PID Features
Changing the Output at Setpoint
Output at Minimum / Output at Maximum
Filtering
Minimum Accumulated Error
Page
Page
Medium Resolution
Reuccf
Page
Page
Refer to .1.9, Powering
Appendix F Troubleshooting
Echelon Network
Appendix F Troubleshooting F-3
Symptom Possible Problem Solution
Trip
Number of Fans field?
Symptom Possible Problem Solution
Appendix F Troubleshooting F-7
Figured as an analog input
Page
Page
Appendix G Revision Log
Page
Numerics
Index
Blue R. See Cold Reset
Wash mode. See Clean Mode
Demand Defrost. See Defrost, demand
Hot Gas Defrost. See Defrost, hot gas
Tion Probe
LonWorks Network. See Echelon Network
Pmac
Hansen probe. See Sensors, liquid level
10 E2 RX/BX/CX I&O Manual Rev 4 5-JAN-2013
Valves