|
| Accessing Hub Features |
|
| Interpreting Device Status |
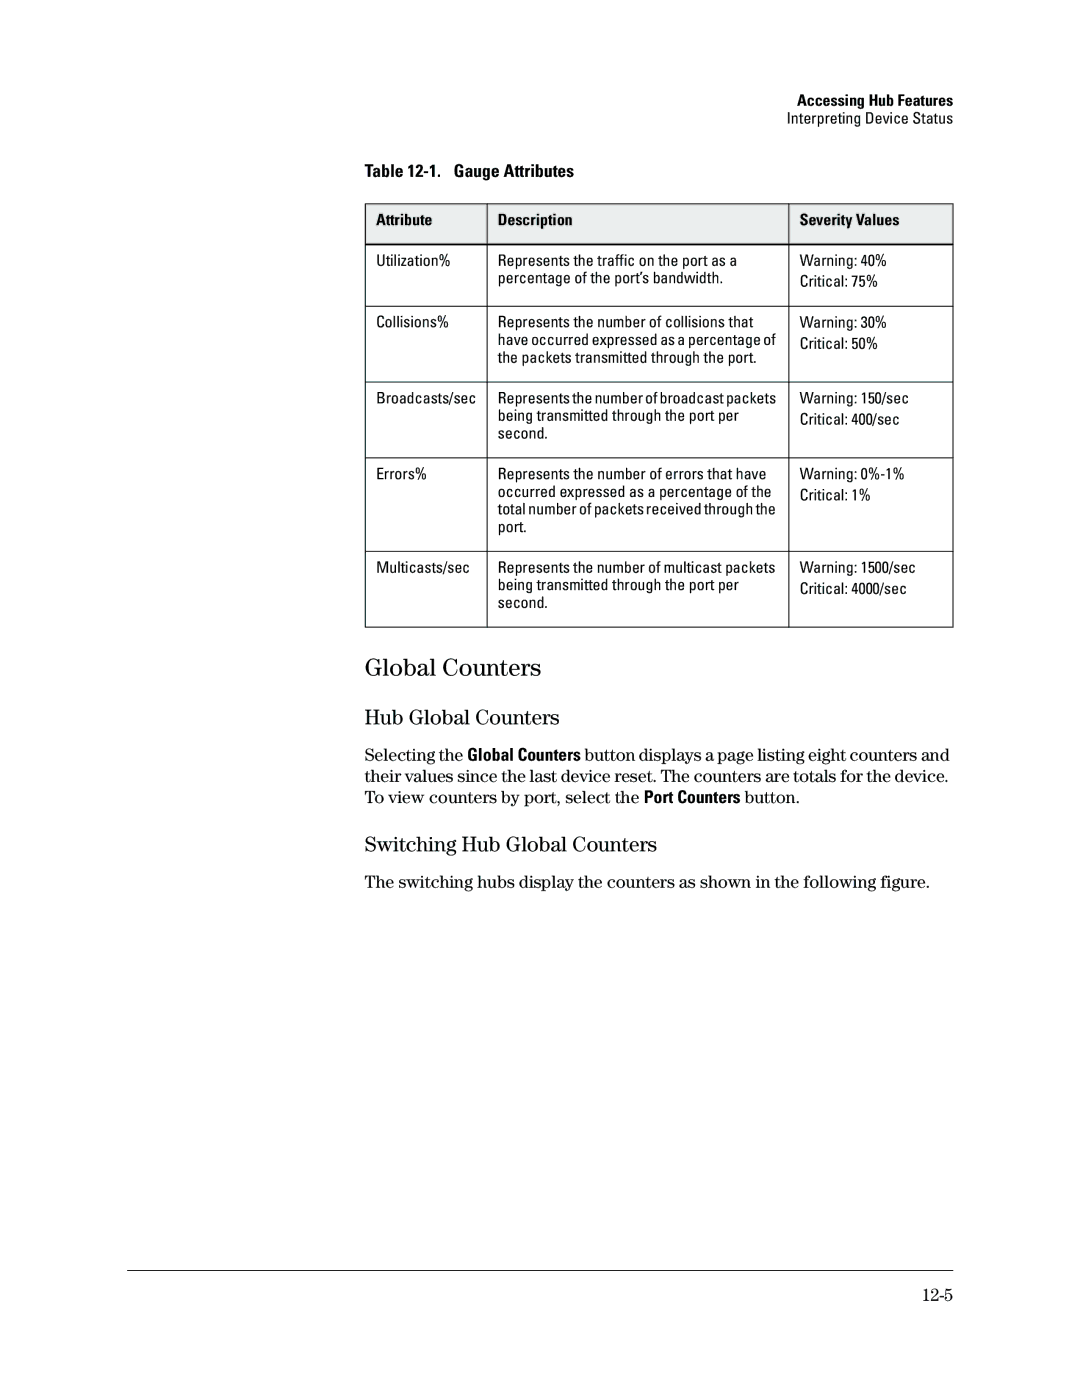
Table |
| |
|
|
|
Attribute | Description | Severity Values |
|
|
|
Utilization% | Represents the traffic on the port as a | Warning: 40% |
| percentage of the port’s bandwidth. | Critical: 75% |
|
|
|
Collisions% | Represents the number of collisions that | Warning: 30% |
| have occurred expressed as a percentage of | Critical: 50% |
| the packets transmitted through the port. |
|
|
|
|
Broadcasts/sec | Represents the number of broadcast packets | Warning: 150/sec |
| being transmitted through the port per | Critical: 400/sec |
| second. |
|
|
|
|
Errors% | Represents the number of errors that have | Warning: |
| occurred expressed as a percentage of the | Critical: 1% |
| total number of packets received through the |
|
| port. |
|
|
|
|
Multicasts/sec | Represents the number of multicast packets | Warning: 1500/sec |
| being transmitted through the port per | Critical: 4000/sec |
| second. |
|
|
|
|
Global Counters
Hub Global Counters
Selecting the Global Counters button displays a page listing eight counters and their values since the last device reset. The counters are totals for the device. To view counters by port, select the Port Counters button.
Switching Hub Global Counters
The switching hubs display the counters as shown in the following figure.
