N o t e
N o t e
Monitoring Network Traffic
Who Are the Top 5 Talkers?
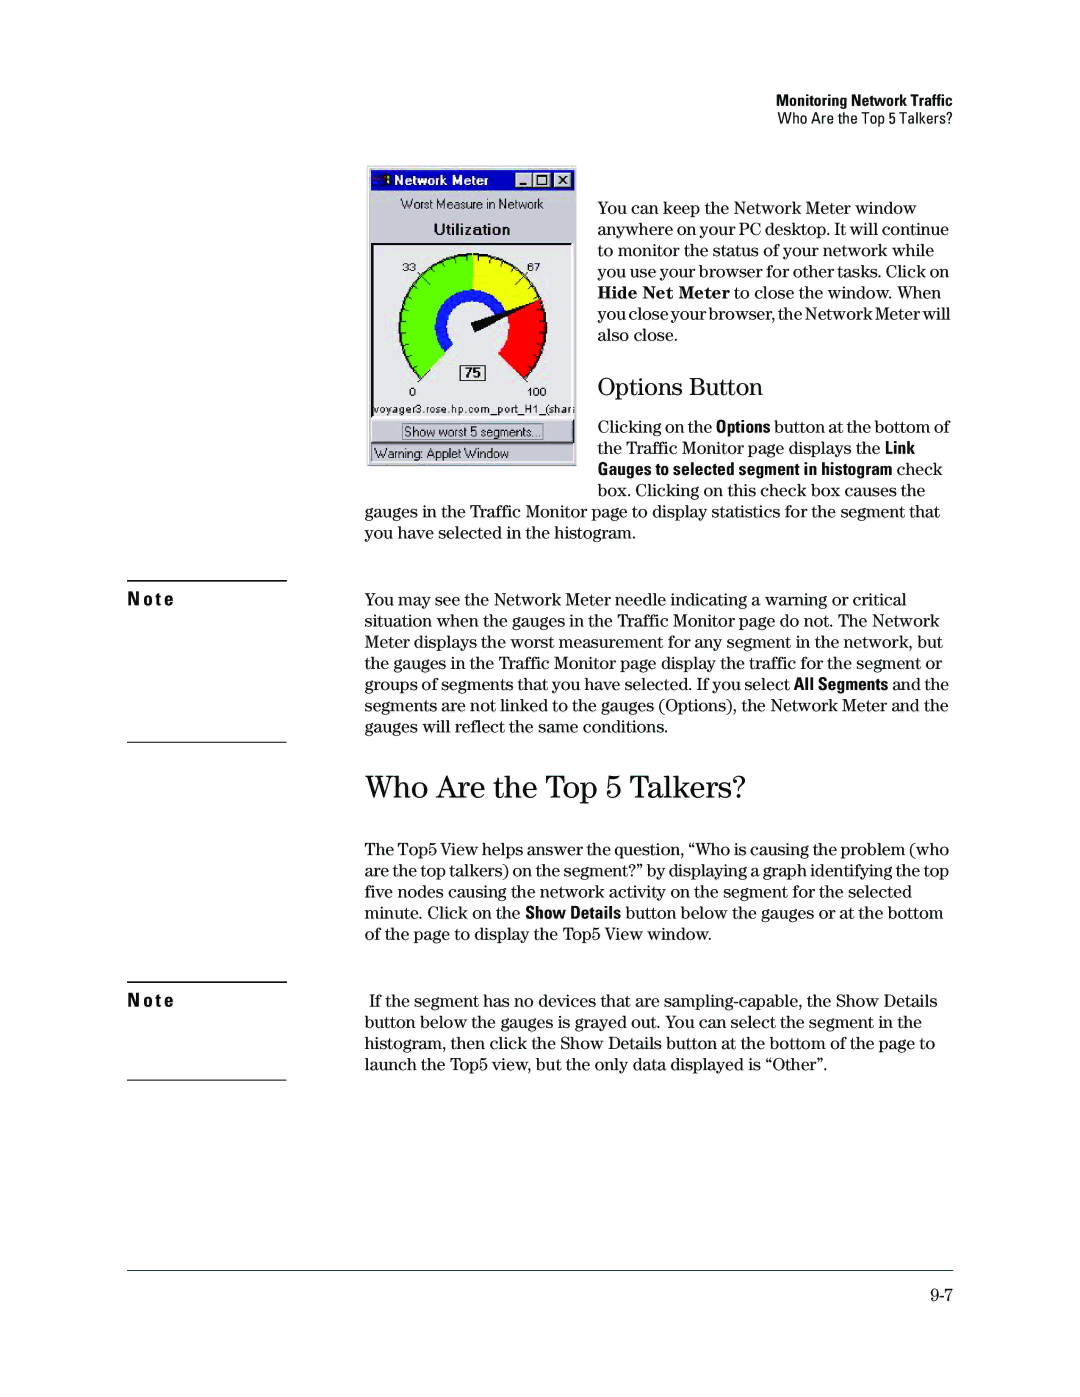
You can keep the Network Meter window anywhere on your PC desktop. It will continue to monitor the status of your network while you use your browser for other tasks. Click on Hide Net Meter to close the window. When you close your browser, the Network Meter will also close.
Options Button
Clicking on the Options button at the bottom of the Traffic Monitor page displays the Link Gauges to selected segment in histogram check box. Clicking on this check box causes the
gauges in the Traffic Monitor page to display statistics for the segment that you have selected in the histogram.
You may see the Network Meter needle indicating a warning or critical situation when the gauges in the Traffic Monitor page do not. The Network Meter displays the worst measurement for any segment in the network, but the gauges in the Traffic Monitor page display the traffic for the segment or groups of segments that you have selected. If you select All Segments and the segments are not linked to the gauges (Options), the Network Meter and the gauges will reflect the same conditions.
Who Are the Top 5 Talkers?
The Top5 View helps answer the question, “Who is causing the problem (who are the top talkers) on the segment?” by displaying a graph identifying the top five nodes causing the network activity on the segment for the selected minute. Click on the Show Details button below the gauges or at the bottom of the page to display the Top5 View window.
If the segment has no devices that are
