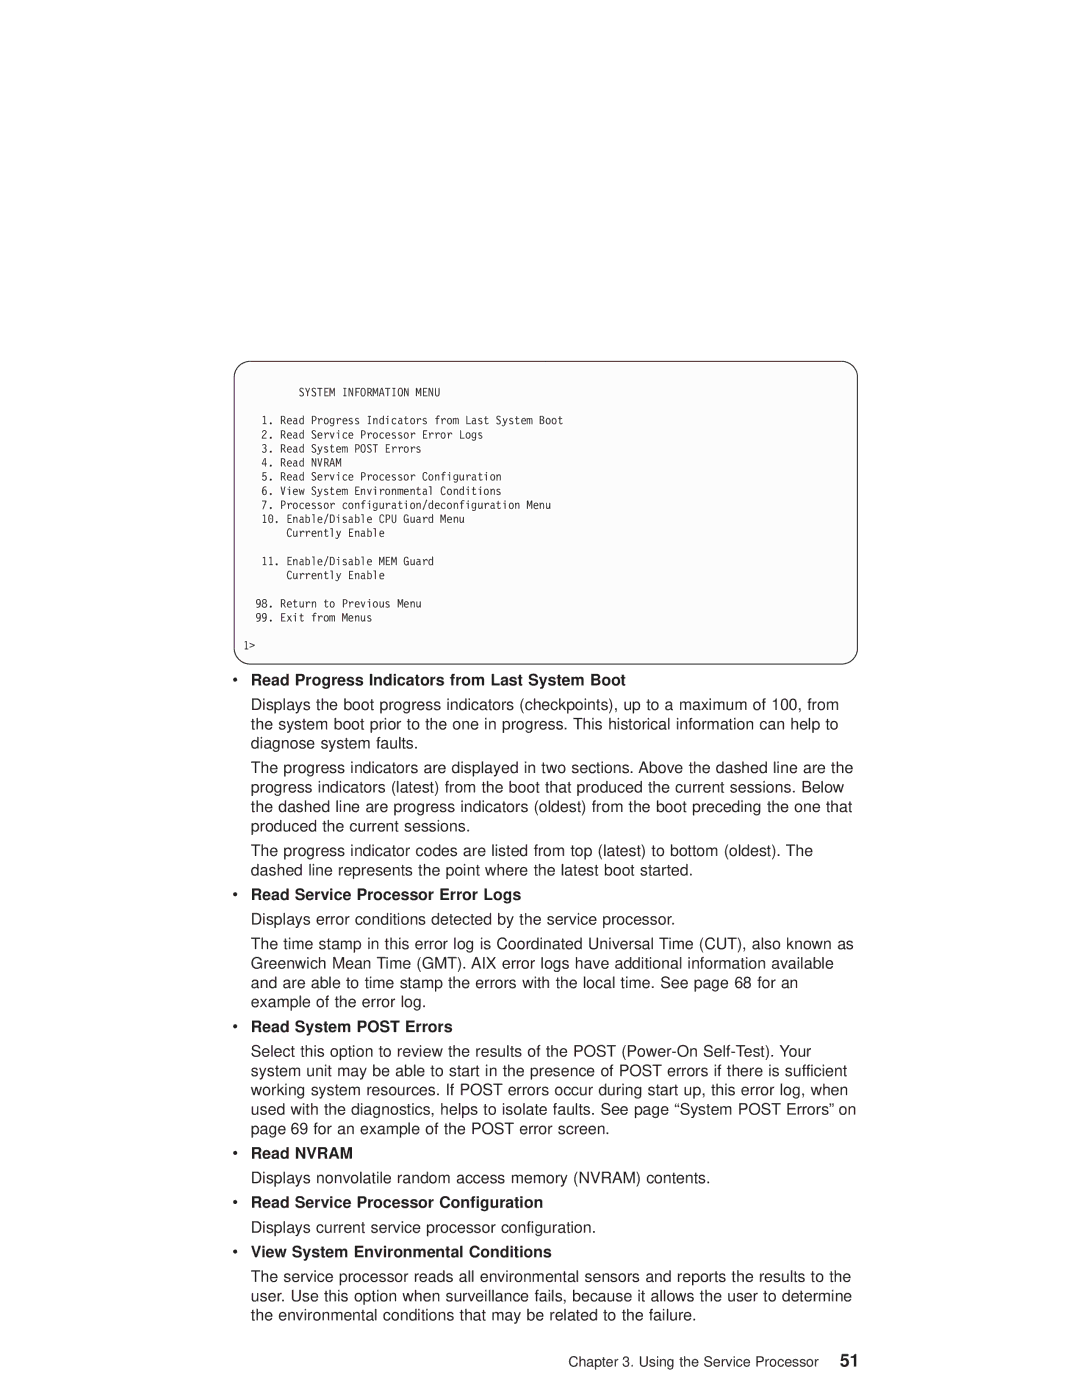
SYSTEM INFORMATION MENU
1.Read Progress Indicators from Last System Boot
2.Read Service Processor Error Logs
3.Read System POST Errors
4.Read NVRAM
5.Read Service Processor Configuration
6.View System Environmental Conditions
7.Processor configuration/deconfiguration Menu
10.Enable/Disable CPU Guard Menu Currently Enable
11.Enable/Disable MEM Guard Currently Enable
98.Return to Previous Menu
99.Exit from Menus
1>
vRead Progress Indicators from Last System Boot
Displays the boot progress indicators (checkpoints), up to a maximum of 100, from the system boot prior to the one in progress. This historical information can help to diagnose system faults.
The progress indicators are displayed in two sections. Above the dashed line are the progress indicators (latest) from the boot that produced the current sessions. Below the dashed line are progress indicators (oldest) from the boot preceding the one that produced the current sessions.
The progress indicator codes are listed from top (latest) to bottom (oldest). The dashed line represents the point where the latest boot started.
vRead Service Processor Error Logs
Displays error conditions detected by the service processor.
The time stamp in this error log is Coordinated Universal Time (CUT), also known as Greenwich Mean Time (GMT). AIX error logs have additional information available and are able to time stamp the errors with the local time. See page 68 for an example of the error log.
vRead System POST Errors
Select this option to review the results of the POST
vRead NVRAM
Displays nonvolatile random access memory (NVRAM) contents.
vRead Service Processor Configuration Displays current service processor configuration.
vView System Environmental Conditions
The service processor reads all environmental sensors and reports the results to the user. Use this option when surveillance fails, because it allows the user to determine the environmental conditions that may be related to the failure.
Chapter 3. Using the Service Processor 51