WS5100 Series Switch
Motorola, Inc. All rights reserved
Contents
Switch Services
Network Setup
TOC-3
Switch Security
Diagnostics
Switch Management
TOC-5
TOC-6WS5100 Series Switch System Reference Guide
Documentation Set
Introduction
Document Conventions
Notational Conventions
Hardware Overview
Overview
Power Cord Specifications
Physical Specifications
Power Protection
System Status LED Codes
Start Up
Error Codes
Primary
Standby
Switch includes the following Infrastructure features
Infrastructure Features
Software Overview
Configuration Management
Installation Feature
Text Based Configuration
Licensing Support
Tracing / Logging
Serviceability
Process Monitor
Hardware Abstraction Layer and Drivers
Password Recovery
Wireless Switching
Switch includes the following wireless switching features
Secure Network Time Protocol Sntp
802.11bg
Physical Layer Features 802.11a
Rate Limiting
HotSpot / IP Redirect
Proxy-ARP
Voice Prioritization
IDM Identity Driven Management
Self Healing
Currently voice support implies the following
Wireless Capacity
Neighbor Configuration
Detector APs
Self Healing Actions
Wireless Roaming
AP Balancing Across Multiple Switches
MU Balancing Across Multiple APs
MU Move Command
Interswitch Layer 2 Roaming
L3 Roaming
Fast Roaming
2.12 QoS
Power Save Polling
802.11e QoS
802.1p Support
Data QoS
Wireless Layer 2 Switching
Dcscp to AC Mapping
Automatic Channel Selection
Switch includes the following wired switching features
Wired Switching
Dhcp Servers
Ddns
WS5100 switch supports 32 Wlans
Management Features
Vlan Enhancements
Interface Management
Encryption and Authentication
Security Features
Switch includes the following wired security features
Keyguard-WEP
MU Authentication
Kerberos
802.1x EAP
5.7 802.1x Authentication
Switch-to-Wired
Secure Beacon
MU to MU Allow
Reset Username/Password to Factory Defaults
Change Username/Password after AP Adoption
Lldp is always enabled and cannot be disabled
Ieee 802.1AB Lldp
Rogue AP Detection
RF scan by Access Port on all channels
Authorized AP Lists
Snmp Trap on discovery
Rogue AP Report
5.14 NAT
Access Port Support
Certificate Management
Content of this chapter is segregated amongst the following
Accessing the Switch Web UI
Web UI Requirements
Connecting to the Switch Web UI
Switch Web UI Access and Image Upgrades
Switch Password Recovery
Upgrading the Switch Image from 1.4.x or 2.x to Version
Upgrading the Switch Image
Auto Installation
Enables are set using the autoinstall feature command
Configuring Auto Install via the CLI
AP-4131 Access Point to Access Port Conversion
Downgrading the Switch Image
Enables are cleared using the no autoinstall feature
Whenever a string is blank it is shown as --not-set
Select the AP Installation main menu item
Select the Special Functions main menu item
10WS5100 Series Switch System Reference Guide
It consists of the following two tabs
Viewing the Switch Interface
Viewing the Switch Configuration
Time Displays the time of day used by the switch Time Zone
Troubleshooting
Incorrectly could render your switch as operating illegally
System Name
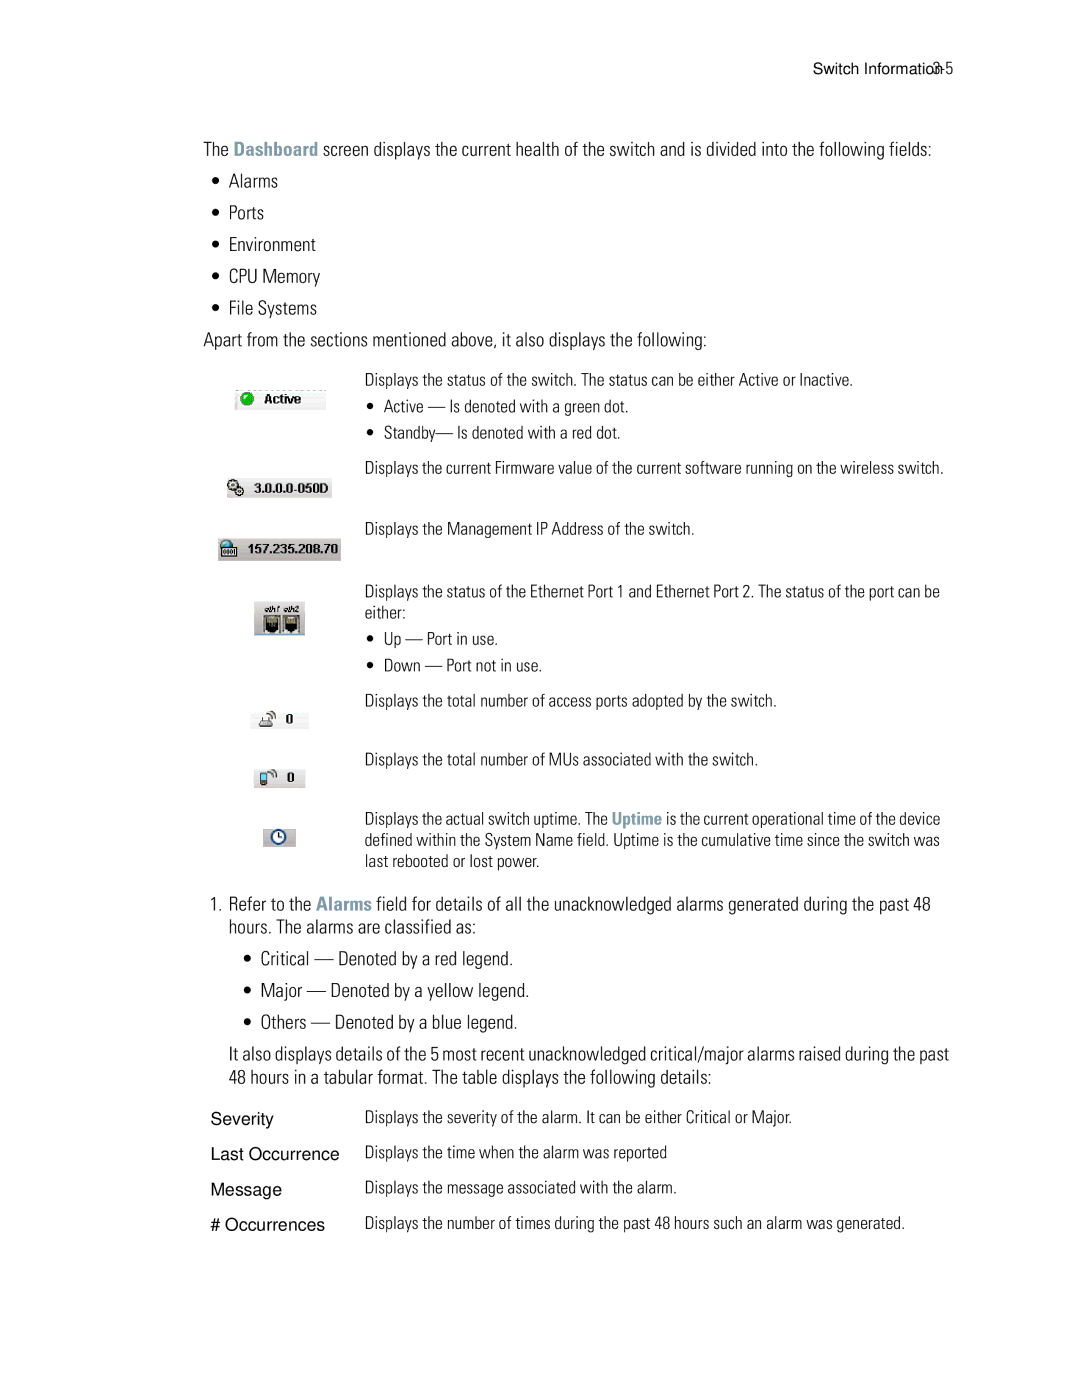
Viewing Dashboard Details
Severity Last Occurrence Message # Occurrences
Name
Viewing Switch Statistics
Status
Speed
Avg Signal
Utilization issues negatively impacting performance
Number of MUs
Associated Number of APs
Viewing the Port Configuration
Viewing Switch Port Information
Modified
Editing the Port Configuration
Duplex Displays the port as either half or full duplex
Viewing the Ports Runtime Status
Viewing the Ports Statistics
Ethernet ports have a maximum MTU setting
Name Displays the ports current name MAC Address
Oper Status
Indication of a network problem
Packets In Error
Network issues
Different port could be required
Detailed Port Statistics
Output Unicast
Viewing the Port Statistics Graph
Output Packets
With interface is saturated
Switch Information
Size Bytes
Viewing Switch Configurations
Viewing the Detailed Contents of a Config File
Main screen displays the contents of the configuration file
Editing a Config File
Transferring a Config File
Password
Viewing Switch Firmware Information
Path
Editing the Switch Firmware
Enabling Global Settings for the Failover Image
If using TFTP, use tftp//ipaddress/path/filename
Updating the Switch Firmware
Enable
Configuring Automatic Updates
Boot of the switch
Password Enter the password required to access the server
Setting
File Name With
Protocol
View By
Viewing the Switch Alarm Log
View All
Index
Viewing Alarm Log Details
Solution
Viewing Switch Licenses
Description
Possible Causes
How to use the Filter Option
30WS5100 Series Switch System Reference Guide
Displaying the Network Interface
Network Setup
Switch Virtual
Resolution Entries
Wireless LANs
DNS Servers
Access Ports
Configuring DNS
Viewing Network IP Information
Select the Domain Network System tab
Adding an IP Address for a DNS Server
Configuring Global Settings
Obsolete addresses are periodically removed
Server IP Address
Configuring IP Forwarding
Following details display in the table
Route Metric
Adding a New Static Route
Active
Select the Address Resolution tab
Viewing Address Resolution
Typically a Vlan
Type
Viewing and Configuring Layer 2 Virtual LANs
Ethernet 1 or ethernet
Mode It can be either Access or Trunk
Trunk
Is selected, the Allowed VLANs field is unavailable
Editing the Details of an Existing Vlan
Configuring the Virtual Interface
Configuring Switch Virtual Interfaces
Mode drop-down menu
Name Displays the name of the virtual interface
Following configuration details display in the table
Displays the Vlan ID associated with the interface
Up or not Down
Modifying a Virtual Interface
Adding a Virtual Interface
To add a new virtual interface
To modify an existing virtual interface
Viewing Virtual Interface Statistics
Packets, etc
Viewing Virtual Interface Statistics
Only hard-coded at the factory and cannot be modified
Viewing the Virtual Interface Statistics Graph
Configuring WLANs
Viewing and Configuring Switch WLANs
Click Close to close the dialog
4094. The default Vlan ID is
Enabled
Authentication
Modify the WLAN’s current authentication scheme
Editing the Wlan Configuration
Intended function of the Wlan
Value used is unique
Tunnel
No Authentication
802.1X EAP
Kerberos
Refer to the Advanced field for the following information
Configuring 802.1x EAP
Configuring Authentication Types
MU Timeout
Configuring Kerboros
MU Max Retries
28WS5100 Series Switch System Reference Guide
Switch Hotspot Redirection
Configuring Hotspots
Configuring an Internal Hotspot
Header Text
Title Text
Footer Text
Small Logo URL
Main Logo URL
Configuring External Hotspot
Descriptive Text
Need to provide correct login information to access the Web
Login Page URL
Failed Page URL
34WS5100 Series Switch System Reference Guide
Configuring Advanced Hotspot
Network Setup
Configuring External Radius Server Support
Configuring Dynamic MAC ACL
Authentication data source. The default port is
Address Authentication data source Radius Port
Secret Secondary Radius server Server Timeout
Radius Server
Motorola user privilege values User login source
Configuring the User Login Sources
Configuring Different Encryption Types
Configuring WEP
Key 1011121314 2021222324 3031323334 4041424344
Configuring WEP 128 / KeyGuard
Use the Key #1-4areas to specify key numbers
Default hexadecimal keys for WEP 128 and KeyGuard include
Key
Configuring WPA/WPA2 using Tkip and Ccmp
From entering the 256-bit key each time keys are generated
Ascii Passphrase
Bit Key
Viewing Wlan Statistics
Pre-Authentication
PMK Caching
Opportunistic Key
Ssid is the Service Set ID Ssid for the selected Wlan
That may have similar characteristics
Last 30s
Last Hr
Viewing Wlan Statistics in Detail
Refer to the RF Status field for the following information
Viewing Wlan Statistics in a Graphical Format
Refer to the Errors field for the following information
50WS5100 Series Switch System Reference Guide
Viewing Wlan Switch Statistics
Viewing VLAN/Tunnel Assignments
Edit button on the Configuration tab within the WLANs
Click the VLAN/Tunnel Assignment tab
Configuring WMM
Access
WMM enabled
Four Access Category types are
Background Optimized for background traffic
Category Network traffic Dscp to Access
Access Category to
Category Network traffic
Generic QoS GQoS application programming interface API
Read-only and cannot be modified within this screen
Editing WMM Settings
Viewing MU Status
Viewing Associated MU Details
CW Minimum
CW Maximum
This address is burned into the ROM of the MU
Power Save
Ready
Interoperating with
Viewing MU Details
Similar configurations
Displays of the Wlan the MU is currently associated with
Viewing MU Statistics
Selected MU from the access port
Configuration
Possible network or hardware problems
Address is hard coded at the factory and cannot be modified
Viewing MU Statistics in Detail
Hard-coded at the factory and cannot be modified
Refer to the Traffic field for the following information
View a MU Statistics Graph
Viewing Access Port Information
Access Ports screen consists of the following tabs
Configuring Access Port Radios
Name Displays a user assigned name for the radio
Refer to the Properties field for the following
Configuring Layer 3 Access Port Adoption on
Configuring an AP’s Global Settings
Editing AP Settings
Port Authentication
Click the Configure Port Authentication button
Network Setup
MUs that can associate to a radio is
Maximum MUs
Beacon Interval
RTS Threshold
Self Healing Offset
Configuring Rate Settings
Dtim Periods
Adding APs
Viewing AP Statistics
Average Mbps
Differentiate the radio from other device radios
Packets that are sent and received
RF Util
Viewing AP Statistics in Detail
Was encountered on the configured channel
Statistic for the last hour
Viewing AP Statistics in Graphical Format
Click the Wlan Assignment tab
Configuring Wlan Assignment
Editing a Wlan Assignment
Configurations
Its intended coverage area or function
Identifier such as 1/4, 1/3, etc
From the description field in the Radio Configuration screen
Editing WMM Settings
Configuring AP Adoption Defaults
Viewing Access Port Adoption Defaults
To view existing Radio Configuration information
Channel. Default is random
Options include Indoor or Outdoor. Default is Indoor
Power dBm
Defaults are 20 dBM for 802.11bg and 17 dBm for 802.11a
Editing Default Radio Adoption Settings
Stations that can associate to a radio are
Dtim Period
Transmission path
Configuring Rate Settings
Configuring Layer 3 Access Port Adoption
Select/Change Assigned WLANs
Assigned WLANs tab displays two fields Select Radios/BSS
Cannot be modified
Access Category reflects the radios intended network traffic
To edit the existing WMM settings
Editing Access Port Adoption WMM Settings
Higher priority traffic
Viewing Adopted Access Ports
Viewing Access Port Status
Viewing Unadopted Access Ports
Unadopted AP tab displays the following information
Network Setup
96WS5100 Series Switch System Reference Guide
Switch Services
To display a Services Summary
Displaying the Services Interface
Dhcp Servers
NTP Time
Configuring the Switch Dhcp Server
Dhcp Server Settings
For information on configuring GRE tunneling, see
Pool Name
Lease Time
Editing the Properties of an Existing Dhcp Pool
Ddhhmm
Domain
Adding a New Dhcp Pool
Click the Add button at the bottom of the screen
Configuring Dhcp Global Options
Configuring Dhcp Server Ddns Values
10WS5100 Series Switch System Reference Guide
Can be assigned
Viewing the Attributes of Existing Host Pools
Hardware Address
Client Name
Configuring Excluded IP Address Information
Configuring Dhcp Server Relay Information
14WS5100 Series Switch System Reference Guide
Viewing Dhcp Server Status
Defining the Sntp Configuration
Configuring Secure NTP
Refer to the contents of the Status tab for the following
Refer to the Other Settings field to define the following
Adding a New Sntp Symmetric Key
Defining a Sntp Neighbor Configuration
Hostname
When adding or editing an NTP neighbor
Support
Neighbor Type
Adding an NTP Neighbor
Viewing Sntp Associations
Select the NTP Associations tab
Leap
Viewing Sntp Status
Transmissions are synchronized
Found in some workstations
Root delay
Configuring Switch Redundancy
Root Dispersion
26WS5100 Series Switch System Reference Guide
Redundancy ID
Redundancy Switch
Mode
Discovery Period
Reviewing Redundancy Status
Redundancy Group License Aggregation Rules on
Configuring Redundancy Group Membership
Not Seen The member is no more seen by this switch
Do not match this switch’s parameters
Values
Module
Displaying Redundancy Member Details
Updates Sent
Complimentary with this switch’s version?
Updates Received
Adoption Capacity
Adding a Redundancy Group Member
Redundancy Group License Aggregation Rules
Layer 3 Mobility
Configuring Layer 3 Mobility
36WS5100 Series Switch System Reference Guide
Switch Services
Defining the Layer 3 Peer List
Select the Peer Statistics tab
Reviewing Layer 3 Peer List Statistics
Reviewing Layer 3 MU Status
Configuring GRE Tunnels
Assigning priority to different types of traffic
Source IP
To configure GRE tunnelling on the switch
Destinations IP
Editing the Properties of a GRE Tunnel
Disabled
Interface IP
Adding a New GRE Tunnel
Select the Enable Neighbor Recovery checkbox
Configuring Self Healing
Select the Neighbor Details tab
Configuring Self Healing Neighbor Details
Editing the Properties of a Neighbor
Switch Services
Configuring Discovery Profiles
Configuring Switch Discovery
To be located
Profile Name
Start IP Address
Network devices is conducted
Adding a New Discovery Profile
Viewing Discovered Switches
Different profile for the switch discovery process
Assigned using the Switch Configuration screen
Discovery profile and launching a new search
New search
Displaying the Main Security Interface
Switch Security
Detection
Wireless Filters
Certificates
Trustpoints
To configure AP Detection
Enabling and Configuring AP Detection
AP Intrusion Detection
Unapproved AP
Timeout
Refresh Time
BSS MAC Address
Any MAC Address
Adding or Editing an Allowed AP
Specific MAC
Address Particular index
To review the attributes of allowed APs
Approved APs Reported by APs
Therefore interpreted as a threat on the network
Unapproved APs Reported by APs
Address to a new Allowed AP index
Dbm
Seconds Detecting AP
Unapproved APs Reported by MUs
Essid to a new Allowed AP index
To configure MU intrusion detection
Configuring MU Intrusion Detection
MU Intrusion Detection
As a threat
Contents of the MUs that have been filtered thus far
Switch columns
Violation Type
Mobile Unit
Viewing Filtered MUs
Click on Revert to rollback to the previous configuration
Identifier
Configuring Wireless Filters
Refer to the Associated WLANs field for following
Filters field contains the following read-only information
Editing an Existing Wireless Filter
Enter the a hex value for the Starting MAC address
Adding a new Wireless Filter
Associating an ACL with Wlan
Configuring ACLs
ACL Overview
Switch supports the following ACLs to filter traffic
Router ACLs
For more information, see
Port ACLs
ACL Actions
Wireless LAN ACLs
Precedence Order
Adding a New ACL
Configuring an ACL
Adding a New ACL Rule
22WS5100 Series Switch System Reference Guide
Editing an Existing Rule
Attaching an ACL
Adding a New ACL Configuration
Eth1
Eth2
Click on the Attach tab Click on the Add button
Attaching an ACL on a Wlan Interface/Port
Displays the IP ACL configured
Adding a New ACL Wlan Configuration
Displays the MAC ACL configured
Direction
Reviewing ACL Statistics
Defining Dynamic NAT Translations
Configuring NAT Information
Click on the Dynamic Translation tab
LAN over the switch managed network
Anywhere on the Internet
Access List
Type Displays the NAT type as either
Adding a New Dynamic NAT Configuration
Click the Static Translation tab
Defining Static NAT Translations
Click on the Static Translation tab
Adding a New Static NAT Configuration
Switch Security
Available from the drop-down menu for use as the interface
Configuring NAT Interfaces
Viewing NAT Status
Inside-Global
Configuring IKE Settings
World
Inside Local
Click the Configurations tab
Defining the IKE Configuration
Aggressive Mode
Setting IKE Policies
Peer IP Address
Peers
Switch Security
Default value
SHA The default value
Priority
Highest priority value
Options include
Include
Secret without transmitting it to one another
Viewing SA Statistics
Configure a Dhcp Sever to give public IP address
Configuring IPSec VPN
Configure security associations parameters
Defining the IPSec Configuration
Transport
Editing an Existing Transform Set
Adding a New Transform Set
AH Authentication
ESP Encryption
Tunnel or Transport
Scheme Include None No AH authentication is used
Click the IP Range tab to view the following information
Defining the IPSec VPN Remote Configuration
Configuring Ipsec VPN Authentication
Default port is
Click the Authentication tab
Port
Shared Secret
Configuring Crypto Maps
Click the Crypto Maps tab and select Crypto Map Entries
Crypto Map Entries
Priority / Seq
ACL ID
Mode Config
Crypto Map Peers
Priority / Seq #
Click the Crypto Maps tab and select Peers
Higher the priority
Peer Name
Transform Set
Crypto Map Manual SAs
Set for protecting the data flow
Crypto Map Transform Sets
Protecting the data flow
Crypto Map Interfaces
Viewing IPSec Security Associations
Index from others with similar configurations
Setting up Radius on the switch entails the following
Configuring the Radius Server
Radius Overview
TLS and MD5 Ttls and PAP
Ttls and MSCHAPv2 Peap and GTC Peap and MSCHAPv2
User Database
Using the Switch’s Radius Server Versus an External Radius
Defining the Radius Configuration
Radius Proxy Server Configuration
Radius Client Configuration
Configuring Radius Authentication and Accounting
EAP and Auth Type Specify the EAP type for the Radius server
Cert Trustpoint
Configuring Radius Users
CA Cert Trustpoint
Activity is detected
Guest User
User
Their Radius privileges expire
Configuring Radius User Groups
Guest Group
Select the Groups tab
Time of access
Configured WLANs
Viewing Radius Accounting Logs
Available WLANs
Select the Accounting Logs tab
Creating Server Certificates
Automatically once they reach their limit
Size
Certificate was issued
Using Trustpoints to Configure Certificates
City L
Within the State/Prov stated
Creating a Server / CA Root Certificate
Key for you new certificate
Using the Wizard to Create a New Certificate
78WS5100 Series Switch System Reference Guide
Organization
City
Organization Unit
To use the wizard to delete trustpoint properties
Using the Wizard Delete Operation
Requests
Click the Next button to complete the trustpoint removal
Configuring Trustpoint Associated Keys
Select the Keys tab Keys tab displays the following
Adding a New Key
Key Label
Transferring Keys
84WS5100 Series Switch System Reference Guide
Displaying the Management Access Interface
Switch Management
To configure access control settings on the switch
Configuring Access Control
Log Output
Network. This setting is enabled by default
Enable Telnet
Long as the Enable Telnet option remains enabled
Enable Snmp Retries
360 is associated with the SSH-Server
Configuring Snmp Access
Access Control
Configuring Snmp v1/v2 Access
Community Name
Editing an Existing Snmp v1/v2 Community Name
Configuring Snmp v3 Access
User Name
Unique SNMPv3 usernames and passwords include
Select Management Access Snmp Access from the main menu tree
Editing a Snmp v3 Authentication and Privacy Password
Read-Only errors
Accessing Snmp v2/v3 Statistics
V2/V3 Metrics
Usm Statistics Values
Enabling Trap Configuration
Configuring Snmp Traps
To configure Snmp trap definitions
Redundancy
Wireless
Miscellaneous
Mobility
To configure Snmp trap threshold values
Configuring Trap Thresholds
Threshold Name
Generation
14WS5100 Series Switch System Reference Guide
Radio Range Wlan Range Wireless Units
Wireless Trap Threshold Values
To configure the attributes of Snmp trap receivers
Configuring Snmp Trap Receivers
Adding Snmp Trap Receivers
Editing Snmp Trap Receivers
To add a new Snmp trap receiver
Configuring Local Users
Configuring Management Users
Creating a New Local User
Modifying an Existing Local User
Provides read-only permissions
Redundancy/clustering and control access
Creating a Guest Admin and Guest User
Assign the guest-admin WebUser Administrator access
Configuring Switch Authentication
Assignment is from 1
Not a DNS name
Modify the following Radius Server attributes as necessary
Modifying the Properties of an Existing Radius Server
Address Not a DNS name Radius Server Port
Adding a New Radius Server
Is from 1
Session. The available range is between 0
Switch Management
28WS5100 Series Switch System Reference Guide
Displaying the Main Diagnostic Interface
Diagnostics
Switch Environment
CPU Performance
Switch Disk Allocation
Switch Memory Allocation
Buffer
Usage
Switch Memory Processes
Other Switch Resources
Log Options
Configuring System Logging
Select the Other Resources tab
8WS5100 Series Switch System Reference Guide
Log level
File Management
Made, they have been accounted for
Date
Viewing the Entire Contents of Individual Log Files
Transferring Log Files
Reviewing Core Snapshots
Transferring Core Snapshots
Troubleshooting issues
File extension is always .core for core files
Select a target file, and select the Transfer Files button
Reviewing Panic Snapshots
Size Displays the size of the panic file in bytes Created
Remaining nine are renamed so the newest can be saved as
Panic actually occurred
Transferring Panic Files
Viewing Panic Details
Debugging the Applet
Select Diagnostics Applet Debugging from the main menu
Configuring a Ping
Not received by the switch from its target device
Timeout sec
Time between the switch and its connected device
New ping test is required
Timeoutsec
Modifying the Configuration of an Existing Ping Test
Adding a New Ping Test
Between the switch and its connected device
Within the Configuration tab
Test Name
Test description to convey the overall function of the test
Viewing Ping Statistics
Last Response
Average RTT
24WS5100 Series Switch System Reference Guide
Customer Support Web Site
Motorola’s Enterprise Mobility Support Center
General Information
2WS5100 Series System Reference Guide
Page
Motorola INC