Chapter | PowerLogic™ PM5300 series user guide |
|
|
Related topics
•See “Current demand” on page 81.
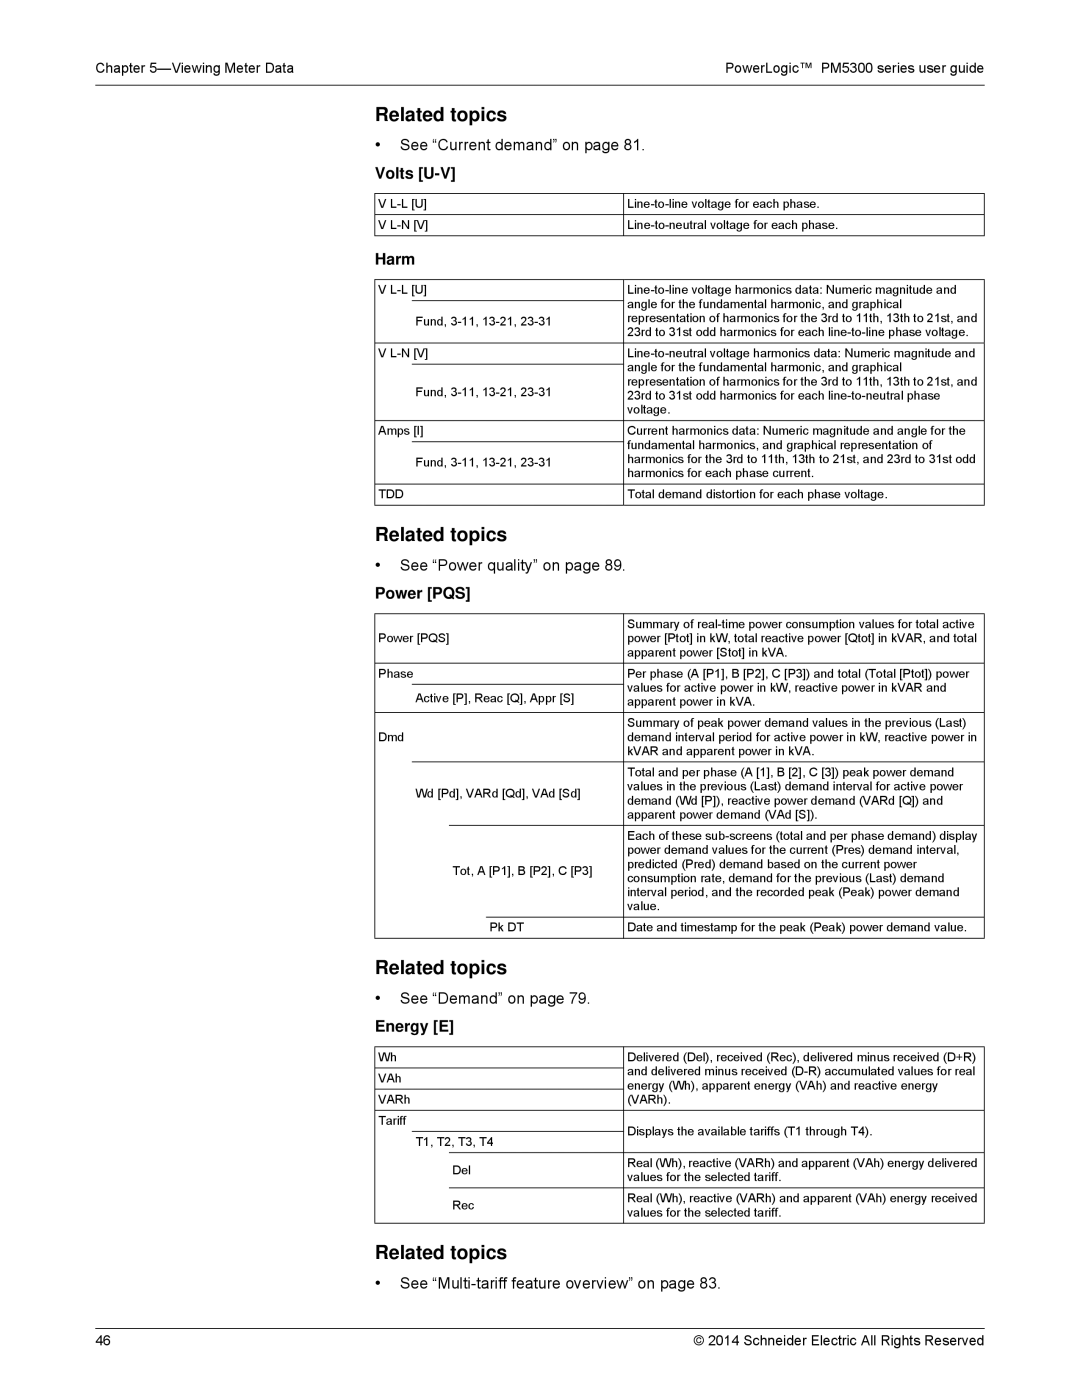
Volts [U-V]
V
Harm
V | ||
|
| angle for the fundamental harmonic, and graphical |
|
| |
| Fund, | representation of harmonics for the 3rd to 11th, 13th to 21st, and |
|
| 23rd to 31st odd harmonics for each |
V | ||
|
| angle for the fundamental harmonic, and graphical |
|
| |
| Fund, | representation of harmonics for the 3rd to 11th, 13th to 21st, and |
| 23rd to 31st odd harmonics for each | |
|
| voltage. |
Amps [I] | Current harmonics data: Numeric magnitude and angle for the | |
|
| fundamental harmonics, and graphical representation of |
|
| |
| Fund, | harmonics for the 3rd to 11th, 13th to 21st, and 23rd to 31st odd |
|
| harmonics for each phase current. |
TDD | Total demand distortion for each phase voltage. | |
|
|
|
Related topics
•See “Power quality” on page 89.
Power [PQS]
|
|
|
| Summary of |
Power [PQS] | power [Ptot] in kW, total reactive power [Qtot] in kVAR, and total | |||
|
|
|
| apparent power [Stot] in kVA. |
Phase | Per phase (A [P1], B [P2], C [P3]) and total (Total [Ptot]) power | |||
|
|
|
| values for active power in kW, reactive power in kVAR and |
| Active [P], Reac [Q], Appr [S] | |||
| apparent power in kVA. | |||
|
|
|
|
|
|
|
|
| Summary of peak power demand values in the previous (Last) |
Dmd | demand interval period for active power in kW, reactive power in | |||
|
|
|
| kVAR and apparent power in kVA. |
|
|
|
| Total and per phase (A [1], B [2], C [3]) peak power demand |
| Wd [Pd], VARd [Qd], VAd [Sd] | values in the previous (Last) demand interval for active power | ||
| demand (Wd [P]), reactive power demand (VARd [Q]) and | |||
|
|
|
| |
|
|
|
| apparent power demand (VAd [S]). |
|
|
|
|
|
|
|
|
| Each of these |
|
|
|
| power demand values for the current (Pres) demand interval, |
|
| Tot, A [P1], B [P2], C [P3] | predicted (Pred) demand based on the current power | |
|
| consumption rate, demand for the previous (Last) demand | ||
|
|
|
| |
|
|
|
| interval period, and the recorded peak (Peak) power demand |
|
|
|
| value. |
|
|
| Pk DT | Date and timestamp for the peak (Peak) power demand value. |
|
|
|
|
|
Related topics
•See “Demand” on page 79.
Energy [E]
Wh |
|
| Delivered (Del), received (Rec), delivered minus received (D+R) |
|
|
| and delivered minus received |
VAh |
|
| |
|
| energy (Wh), apparent energy (VAh) and reactive energy | |
|
|
| |
VARh |
|
| (VARh). |
|
|
|
|
Tariff |
|
| Displays the available tariffs (T1 through T4). |
|
|
| |
| T1, T2, T3, T4 | ||
|
| ||
|
|
|
|
|
| Del | Real (Wh), reactive (VARh) and apparent (VAh) energy delivered |
|
| values for the selected tariff. | |
|
|
| |
|
| Rec | Real (Wh), reactive (VARh) and apparent (VAh) energy received |
|
| values for the selected tariff. | |
|
|
| |
Related topics
•See “Multi-tariff feature overview” on page 83.
46 | © 2014 Schneider Electric All Rights Reserved |