PowerLogic™ PM5300 series user guide | Chapter |
|
|
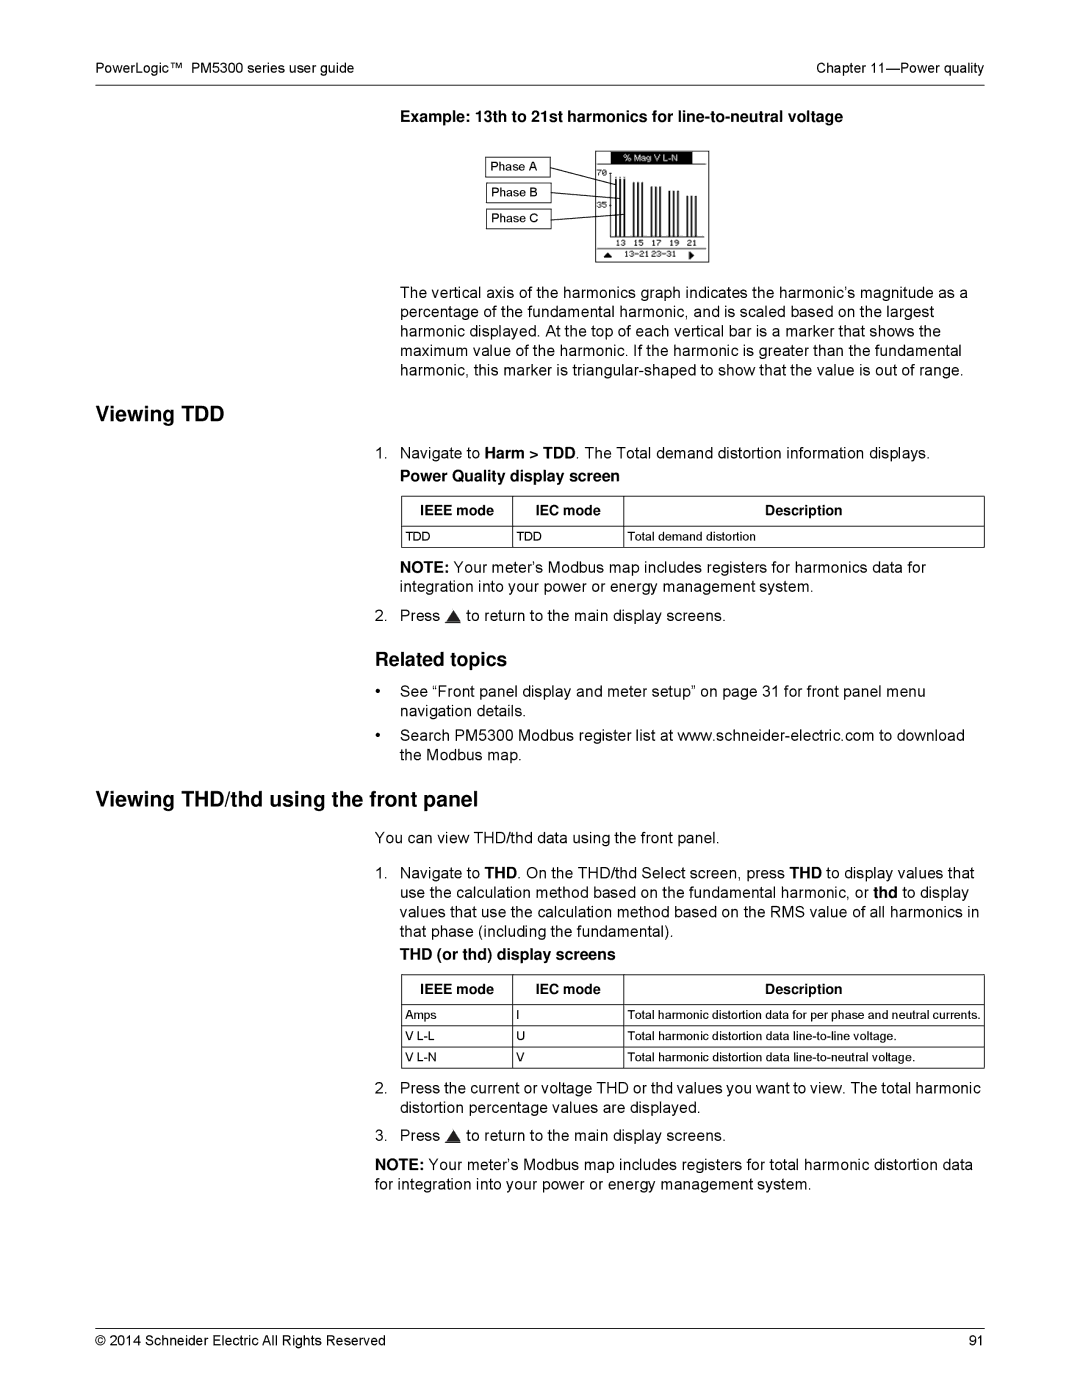
Example: 13th to 21st harmonics for line-to-neutral voltage
Phase A
Phase B
Phase C
The vertical axis of the harmonics graph indicates the harmonic’s magnitude as a percentage of the fundamental harmonic, and is scaled based on the largest harmonic displayed. At the top of each vertical bar is a marker that shows the maximum value of the harmonic. If the harmonic is greater than the fundamental harmonic, this marker is
Viewing TDD
1.Navigate to Harm > TDD. The Total demand distortion information displays.
Power Quality display screen
IEEE mode | IEC mode | Description |
|
|
|
TDD | TDD | Total demand distortion |
NOTE: Your meter’s Modbus map includes registers for harmonics data for integration into your power or energy management system.
2. Press to return to the main display screens.
Related topics
•See “Front panel display and meter setup” on page 31 for front panel menu navigation details.
•Search PM5300 Modbus register list at
Viewing THD/thd using the front panel
You can view THD/thd data using the front panel.
1. | Navigate to THD. On the THD/thd Select screen, press THD to display values that | |||
| use the calculation method based on the fundamental harmonic, or thd to display | |||
| values that use the calculation method based on the RMS value of all harmonics in | |||
| that phase (including the fundamental). | |||
| THD (or thd) display screens |
| ||
|
|
|
|
|
|
| IEEE mode | IEC mode | Description |
|
|
|
|
|
|
| Amps | I | Total harmonic distortion data for per phase and neutral currents. |
|
|
|
|
|
|
| V | U | Total harmonic distortion data |
|
|
|
|
|
|
| V | V | Total harmonic distortion data |
|
|
|
|
|
2. | Press the current or voltage THD or thd values you want to view. The total harmonic | |||
| distortion percentage values are displayed. | |||
3. | Press to return to the main display screens. | |||
NOTE: Your meter’s Modbus map includes registers for total harmonic distortion data for integration into your power or energy management system.
© 2014 Schneider Electric All Rights Reserved | 91 |