4Supply a value for each field you want to change, and press Enter after filling in each field.
5Press
▼Viewing logging options
1Select the config menu, and press Enter.
2Select logging, and press Enter.
3Select view, and press Enter.
Using the monitor menu
The monitor menu lets you view the following:
✔Node performance statistics
✔Protocol performance statistics
✔Cache performance statistics
✔Other performance statistics, such as host database, DNS, and cluster
Viewing Node statistics
Node statistics report performance information about the appliance system. These statistics include document hit rates, the number of HTTP transactions per second, and the number of open client and server connections.
▼Viewing node statistics
1 Select the monitor menu, and press Enter.
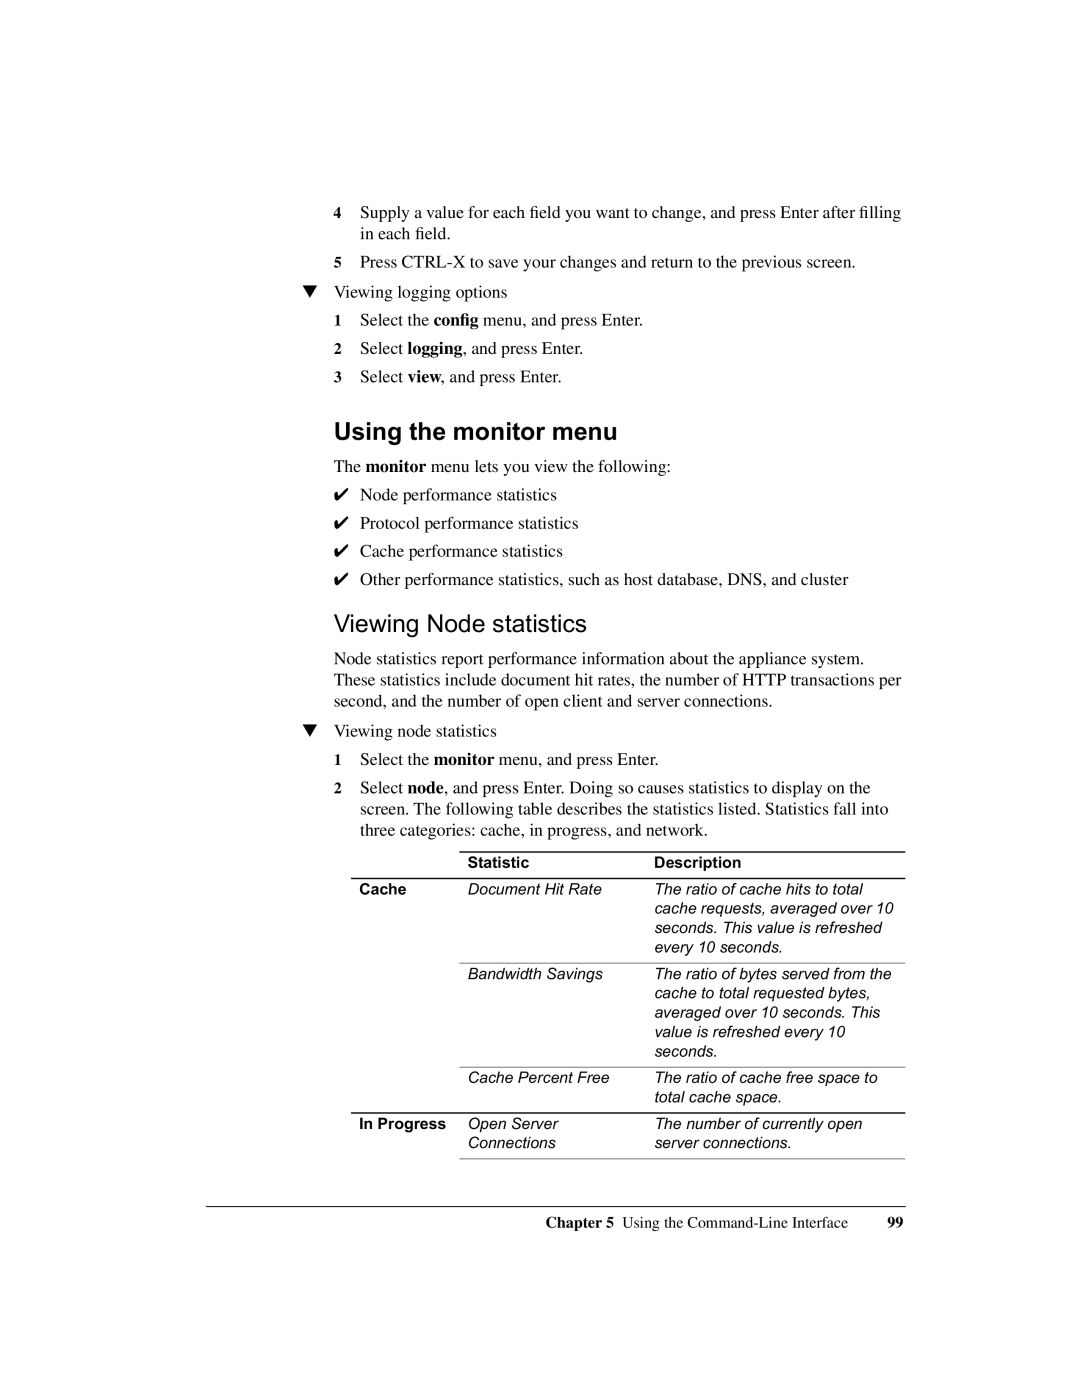
2 Select node, and press Enter. Doing so causes statistics to display on the screen. The following table describes the statistics listed. Statistics fall into three categories: cache, in progress, and network.
| Statistic | Description |
|
|
|
Cache | Document Hit Rate | The ratio of cache hits to total |
|
| cache requests, averaged over 10 |
|
| seconds. This value is refreshed |
|
| every 10 seconds. |
|
|
|
| Bandwidth Savings | The ratio of bytes served from the |
|
| cache to total requested bytes, |
|
| averaged over 10 seconds. This |
|
| value is refreshed every 10 |
|
| seconds. |
|
|
|
| Cache Percent Free | The ratio of cache free space to |
|
| total cache space. |
|
|
|
In Progress | Open Server | The number of currently open |
| Connections | server connections. |
|
|
|
Chapter 5 Using the | 99 |
