▼Viewing logging statistics
1 Select the monitor menu, and press Enter.
2 Select other, and press Enter.
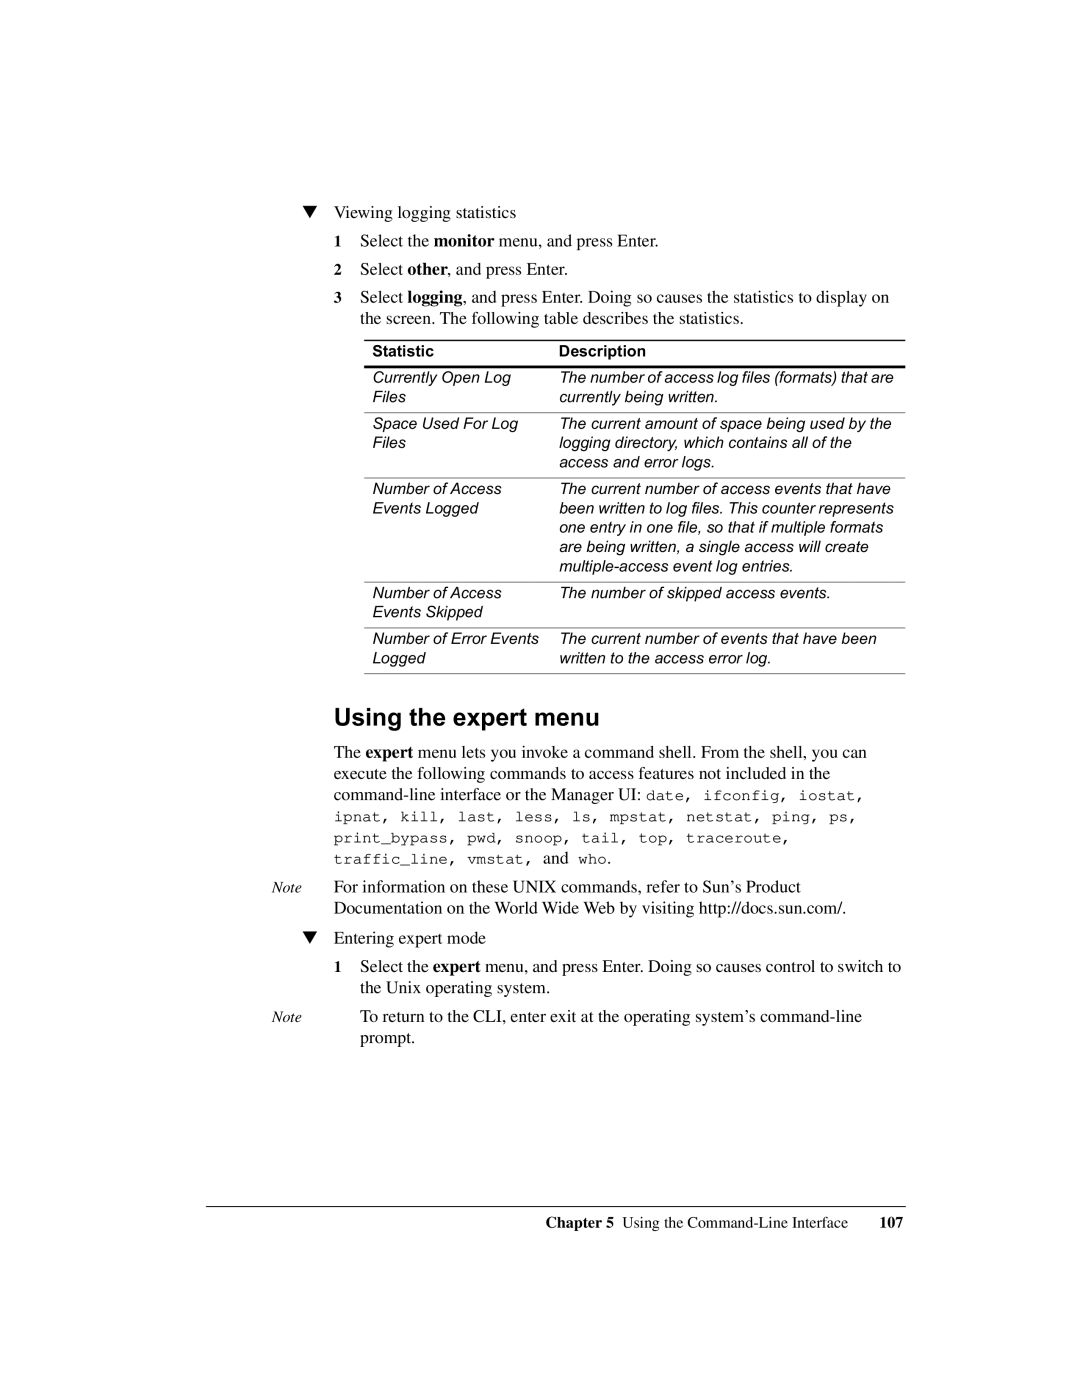
3 Select logging, and press Enter. Doing so causes the statistics to display on the screen. The following table describes the statistics.
Statistic | Description |
|
|
Currently Open Log | The number of access log files (formats) that are |
Files | currently being written. |
|
|
Space Used For Log | The current amount of space being used by the |
Files | logging directory, which contains all of the |
| access and error logs. |
|
|
Number of Access | The current number of access events that have |
Events Logged | been written to log files. This counter represents |
| one entry in one file, so that if multiple formats |
| are being written, a single access will create |
| |
|
|
Number of Access | The number of skipped access events. |
Events Skipped |
|
|
|
Number of Error Events | The current number of events that have been |
Logged | written to the access error log. |
|
|
Using the expert menu
The expert menu lets you invoke a command shell. From the shell, you can execute the following commands to access features not included in the
Note For information on these UNIX commands, refer to Sun’s Product Documentation on the World Wide Web by visiting http://docs.sun.com/.
▼Entering expert mode
1Select the expert menu, and press Enter. Doing so causes control to switch to the Unix operating system.
Note | To return to the CLI, enter exit at the operating system’s |
| prompt. |
Chapter 5 Using the | 107 |
