PowerLogic PM5500 series
Page
Contents
Front panel display and meter setup
Remote meter setup
Meter webpages
Meter logging
Viewing meter data
Input / Output
Meter resets
Alarms
Multi-tariff feature 103
Power quality
Maintenance and upgrades
Measurements and calculations
Power, energy and power factor
Verifying accuracy
MID compliance
Safety information
Important information
Please note
Trademarks
Updates
Class B FCC Part
Reasonable use and responsibility
Model
Chapter Introduction
PM5500 series meter models
Measured parameters
Instantaneous
Power quality
Energy
Demand
Input/Output
Meter configuration
Data display and analysis tools
Data recording
Firmware Meter display language
PM5500 series meter models and supplied hardware PM5560
Chapter
Hardware reference
Meter models
Location of LEDs
LED indicators
Alarm / energy pulsing LED
Heartbeat / serial communications LED
Ethernet communications LEDs
Safety precautions
Before you begin
Meter mounting
Mounting the integrated display model PM5560, PM5561
Removing the PM5563
Mounting the DIN rail mount model PM5563
Direct connect voltage limits
Meter wiring
Power system
Connector locations
Direct connect maximum
Power system setup parameters Power system description
Meter setting
Symbol
Current input protection
Voltage and current input wiring
Balanced system considerations
Voltage input protection
Serial communications
Control power wiring
Communications
Neutral and ground current
RS-485 maximum cable length
RS-485 wiring
RS-485 network configuration
RS-485 cable
Ethernet communications
Ethernet configuration
Ethernet wiring Eth THERNETernet Switch / hub
Digital outputs
Digital inputs
Digital output connections
Digital input connections
Mechanical
Specifications
Mechanical characteristics
Electrical characteristics
Active alarm / energy
RS-485 communications
Environmental characteristics
Safety
EMC electromagnetic compatibility
Real-time clock
Ethernet communications
Front panel LEDs
Chapter Front panel display and meter setup
Heartbeat / communications LED
Parts of the display
Icon
Alarm / energy pulsing LED modes
Notification icons
Notification icons
Meter screen menus
Level 1 screen menus Ieee display mode
Level 1 screen menus IEC display mode
Navigation symbols
Level
PM5560 / PM5561 meter display screen menus
Basic setup screen
Front panel meter setup
Meter setup screen navigation
Configuring basic setup parameters
3VT
Basic setup menu tree
Basic setup parameters
Parameter Values Description
ABC, CBA
Configuring advanced setup parameters
Advanced setup menu tree
Advanced setup parameters
Demand setup
Demand setup menu tree
Power, current, or input demand setup parameters
Serial communications setup menu tree
Multi-tariff setup
Communications setup
Setting up serial communications
Setting up Ethernet communications
RS-485 port settings
Ethernet communications setup menu tree
Bootp
Alarms setup
Input / output setup
Ethernet port settings
Display setup menu tree
HMI settings
Setting up the display
Setting up regional settings
Regional settings setup parameters
Resetting the language
Setting up the screen passwords
Regional settings menu tree
Password setup parameters
Setting the clock
Lost password
Password setup menu tree
Parameter Display format Description
Setting up the alarm / energy pulsing LED
Clock setup menu tree
Clock setup parameters
Front panel display and meter setup HRB1684301-01
Using a web browser to set up Ethernet
Chapter Remote meter setup
Downloading ION Setup
Ethernet port setup
Ethernet & TCP/IP
RS-485 port setup
Meter setup through Ethernet
Click Setup Ethernet
Using a serial communications converter to set up RS-485
Using an Ethernet gateway to set up RS-485
Ascii 8, Ascii
Meter setup through RS-485
Meter configuration using ION Setup
Remote meter setup HRB1684301-01
Chapter Meter webpages
Accessing the meter webpages
Webpages setup
Ethernet communications settings
Final Ethernet configuration steps
Configuring Ethernet settings using a browser
Configuring Ethernet settings using the front panel
Initial Ethernet configuration steps
Device log export setup
User setup
Monitoring Basic Readings
Setting the measurement range
Viewing the meter webpages
Monitoring
Diagnostics
Meter
Communications
Logging out
Maintenance
Maintenance Log
Exporting data logs
Data log
Setting up the data log
Saving the data log contents
Chapter Meter logging
Data log export using a web browser
Alarm log
Maintenance log
Data log export using ION Setup
Displaying data screens
Chapter Viewing meter data
Viewing meter data from the front panel
Meter data display screens
Current
Voltage
Harmonics
Power
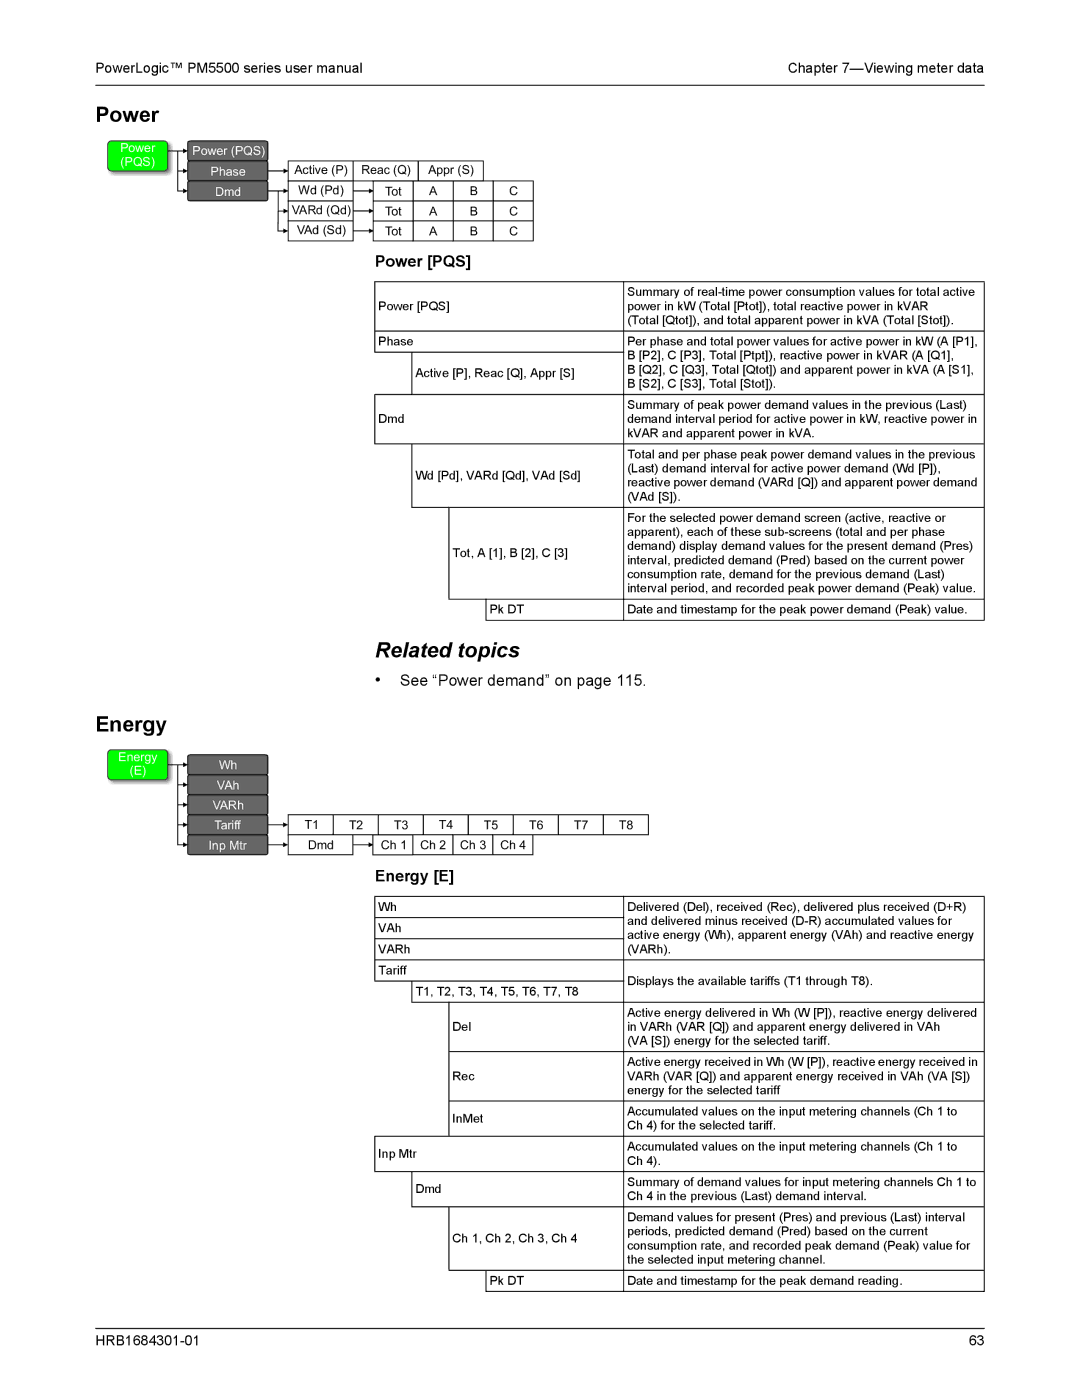
Power PQS
Energy E
Unbalance
Power Factor
Frequency
Total harmonic distortion
Input / Output
Alarm
Alarm
Minimum / maximum
LED
Timer
Timer
Maint
Viewing meter data from a web browser
Using ION Setup to view or modify configuration data
Using software to view meter data
Power Monitoring Expert
Modbus command interface
PowerSCADA Expert
Digital input applications
Input / Output
Wages monitoring
Digital input setup
Configuring digital inputs using ION Setup
Navigate to I/O configuration I/O Setup
Configuring digital inputs using the front panel
Digital input setup parameters available through ION Setup
Digital input setup menu tree
Input metering
Navigate to I/O configuration Input metering
Input metering setup
Configuring input metering using ION Setup
Configuring input metering using the front panel
Unit Code Demand Code Description
Input metering setup menu tree
Demand measurements for input metering
Input metering unit and demand measurements
Using the meter’s display
Viewing input metering data
Digital output applications
Digital output setup
Digital output wiring example
Digital output application example
Digital output setup parameters available through ION Setup
Configuring digital outputs using ION Setup
Digital output setup menu tree
Configuring digital outputs using the front panel
This can be modified only through software. Use this
PM5560, PM5561 PM5563
Location of alarm / energy pulsing LED
Alarm / energy pulsing LED settings menu tree
Energy pulsing
Alarm / energy pulsing LED setup parameters
Navigate to I/O configuration Energy Pulsing
Option or range Description
Input / Output HRB1684301-01
Reset menu tree
Meter resets
Front panel meter reset screens
Global resets
Alarm counter Option Description
Single resets
Single reset options
Alarm counter options
Over kW
Meter resets HRB1684301-01
Unary alarms
Chapter Alarms
Alarm overview
Alarm types
Digital alarms
Standard alarms
Digital alarm with setpoint delay
Over setpoint
Setpoint conditions
ΔT2 ΔT3 EV1 EV2
Under setpoint
PF quadrants and related values
Power factor PF
Standard alarm maximum setpoint values
Maximum allowable setpoint
Lagging PF
Logic alarms
Phase loss
Leading PF
Custom alarms
Custom alarms parameter list
Alarm parameter Unit
Active alarms
Alarms setup overview
Alarm priorities
Built-in error-checking
Setting up digital alarms
Alarm setup using the meter display
Alarm setup using ION Setup
Setting up unary alarms
Setting up standard 1-sec alarms
NOR
Setting up logic alarms
Logic alarm setup parameters
Nand
Setting up custom alarms
Logic alarm setup error prompts
Custom alarm setup parameters
Configuring the LED for alarms using the meter display
LED alarm indicator
Alarm screens
Alarm display and notification
Alarm details
Acknowledging alarms
Active alarms
Alarm history
Alarm counter
Active alarms list and alarm history log
Alarm memory usage
Resetting alarms
Multi-tariff feature
Multi-tariff feature example
Multi-tariff feature overview
Tariff creation method
Command mode overview
Time of day mode overview
Tariff validity
Digital input requirements for required number of tariffs
Input mode overview
Configuration 1 8 tariff assignment using 3 digital inputs1
Configuration 2 8 tariff assignment using 4 digital inputs
Tariff setup menu tree
Configuring tariffs
Configuring time of day mode tariffs
Configuring input mode tariffs using the front panel
Navigate to Meter Tariff
To configure input mode tariffs using the front panel
Multi-tariff feature 108 HRB1684301-01
Energy
Power factor
Chapter Measurements and calculations
Real-time readings
Power factor minimum and maximum
Power factor min/max convention
Power factor sign convention
IEC mode
Block interval demand
Power demand
Power demand calculation methods
Ieee mode
Block interval demand example
Synchronized demand
Thermal demand example
Current demand
Predicted demand
Thermal demand
Predicted demand example
Timer
Operating timer
Peak demand Input metering demand
Load timer
Measurements and calculations 116 HRB1684301-01
Total Harmonic Distortion and Total Demand Distortion
Chapter Power quality
Harmonics overview
Crest factor and K-factor
Harmonic content calculations
THD and thd calculations
TDD calculation
Viewing harmonics using the front panel
Displaying harmonics data
Viewing TDD, K-factor and Crest factor data
Viewing THD/thd using the front panel
Crest Factor display screens
THD or thd display screens
Wrench icon
Chapter Maintenance and upgrades
Maintenance
Troubleshooting LED indicators
Meter memory
Firmware upgrade
Clock battery
Meter firmware and upgrade method
FTP
Using DLF300 to upgrade firmware
Click Continue
Click Add Device
Upgrading the Ethernet card
Click Edit Settings
Phasors
Diagnostics screen
Technical assistance
Info, Meter and Cl Pwr
126 HRB1684301-01
Testing overview
Chapter Verifying accuracy
Accuracy test requirements
Reference device or energy standard
Energy pulsing
Location of energy pulsing LED
Verifying accuracy test
Calculating total power
Percent error calculation
Calculating the number of required pulses
Var-hour test points example
Test points
Energy pulsing considerations
Watt-hour test points example
Adjustments to allow energy pulsing at the digital outputs
VT and CT considerations
Example calculations
Output is
Typical sources of test errors
Verifying accuracy 134 HRB1684301-01
Power flow
Chapter Power, energy and power factor
Power PQS
Power and the PQ coordinate system
Energy delivered / energy received
Power factor PF
True PF and displacement PF
Current phase shift from voltage
PF lead / lag summary
PF sign in IEC mode
Power and PF lead / lag
PF sign convention
PF sign PF sign +
PF sign in Ieee mode
Power factor sign in IEC mode
Power factor sign in Ieee mode
PPF register
Power factor register format
How PF value is stored in the PF register
PF value
Range
Quadrant PF range PF register PF formula
MID compliance for the meter
Specifications relevant to MID
Chapter MID compliance
MID overview
MID compliance
Installation and wiring
Location of terminal covers
Installing the terminal covers
PM5561 default screen
Default PM5561 display screen
Setup menu Setup submenu MID-protected setup parameter
MID-protected setup parameters
Lock-protected setup parameters
MID-protected setup parameters
Clock setup menu
Setting up the PM5561
Basic setup menu
Advanced setup menu
Locking or unlocking the meter
Tariff setup menu
Passwords setup menu
Initializing the meter
Page
Schneider Electric