Functions
4.8 Optimizing a Cam
4.Click the Limits tab to display the minimum and maximum values of the interpolation curve.
Notice
For the slave axis, you can take over the settings of an axis already existing in the project via the menu Cam > Simulation settings and specify the limits of the axis. These simulation settings for the slave axis are used for the calculation of the percentage values which are displayed in the Limits tab.
or
1.Use the handles, which are dependent on the settings in the Interpolation Curve Properties window, to optimize the cam.
2.The mouse pointer shows the direction in which you can move the handle.
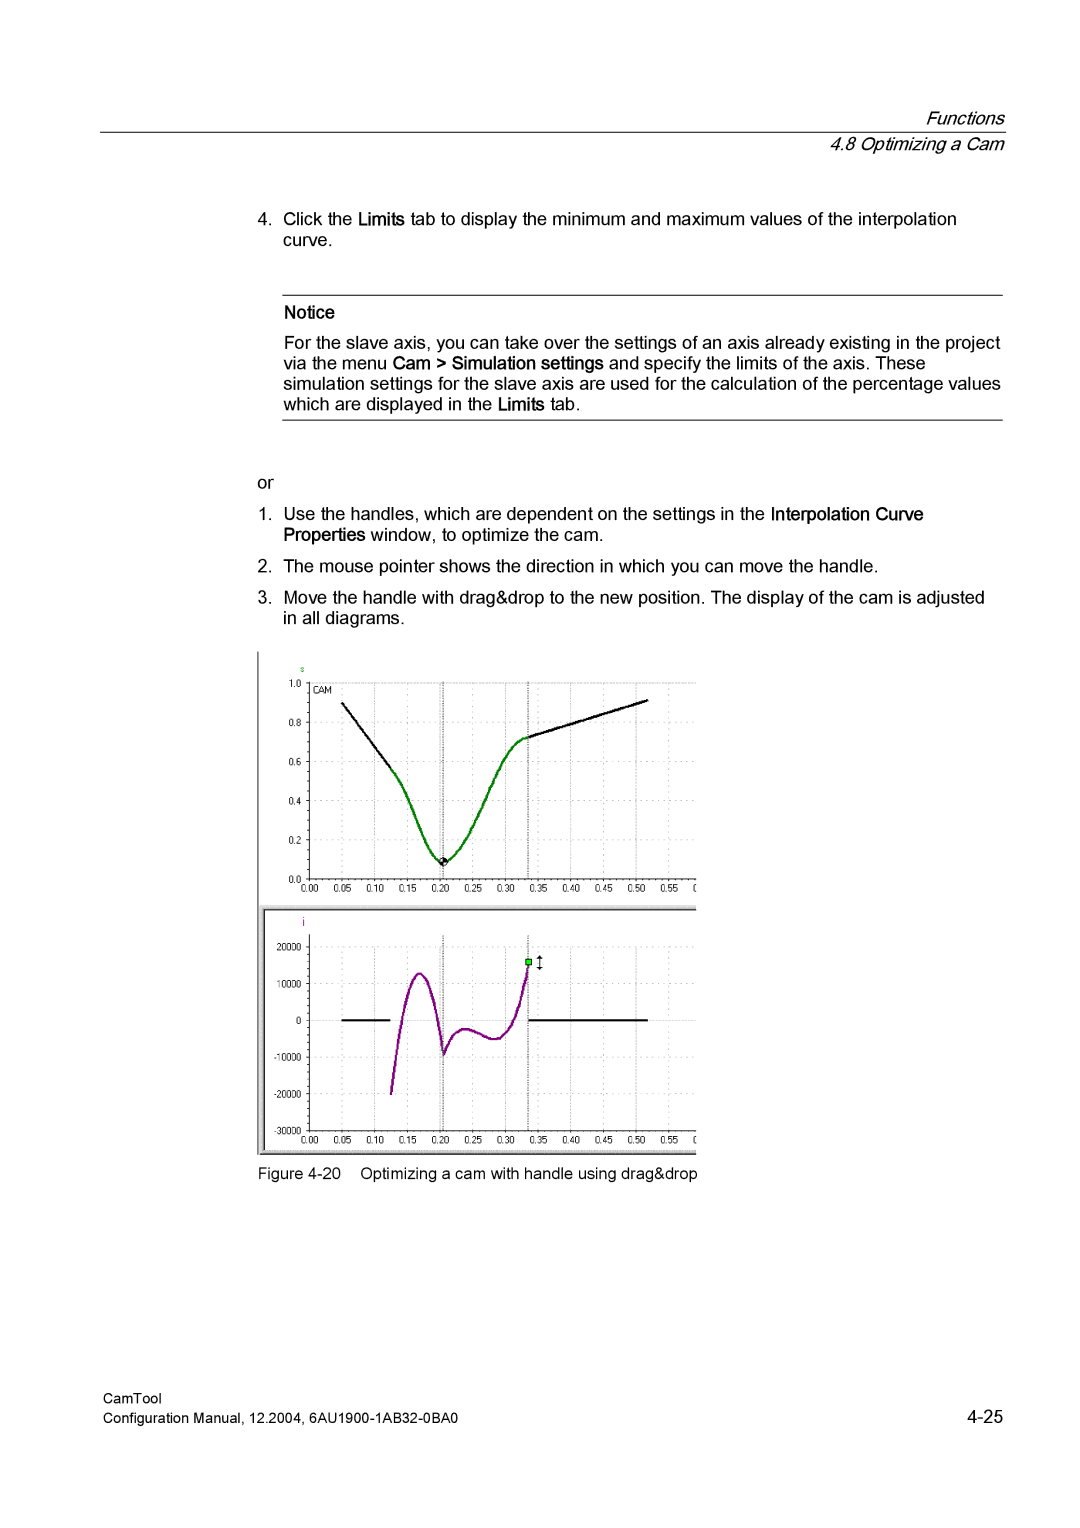
3.Move the handle with drag&drop to the new position. The display of the cam is adjusted in all diagrams.
Figure 4-20 Optimizing a cam with handle using drag&drop
CamTool | |
Configuration Manual, 12.2004, |
