Configuring 3.5 Customize the display of the cam
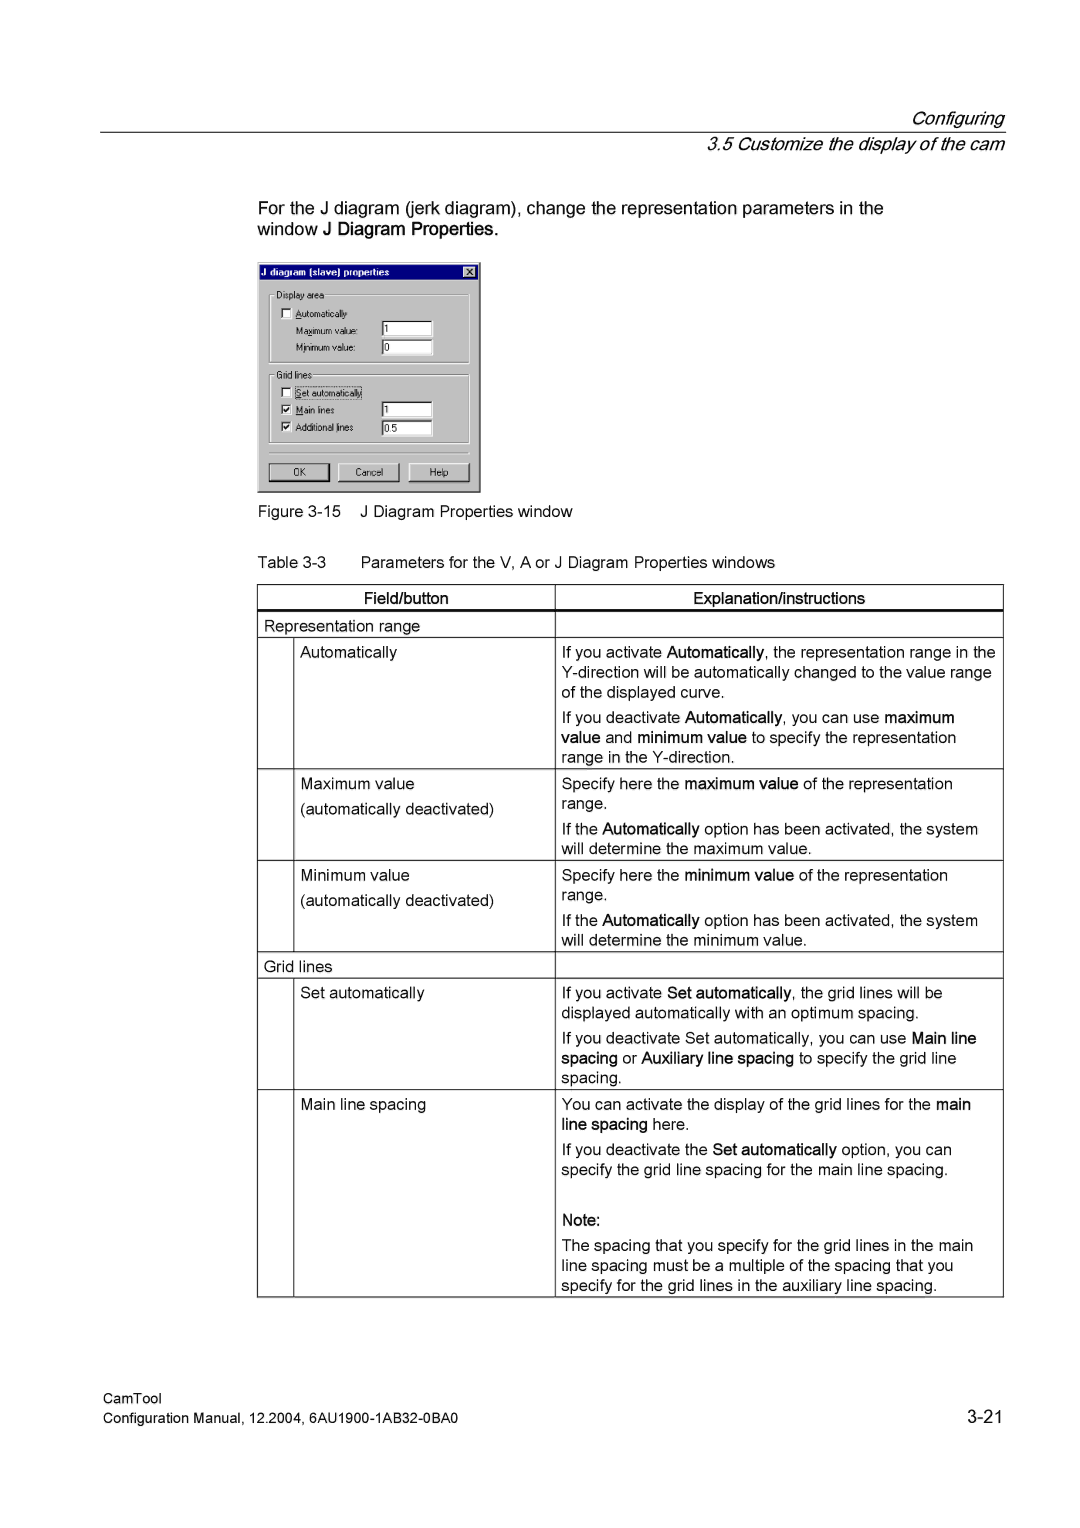
For the J diagram (jerk diagram), change the representation parameters in the window J Diagram Properties.
Figure 3-15 J Diagram Properties window
Table | Parameters for the V, A or J Diagram Properties windows | ||
|
|
|
|
|
| Field/button | Explanation/instructions |
Representation range |
| ||
| Automatically | If you activate Automatically, the representation range in the | |
|
|
| |
|
|
| of the displayed curve. |
|
|
| If you deactivate Automatically, you can use maximum |
|
|
| value and minimum value to specify the representation |
|
|
| range in the |
| Maximum value | Specify here the maximum value of the representation | |
| (automatically deactivated) | range. | |
|
|
| If the Automatically option has been activated, the system |
|
|
| will determine the maximum value. |
| Minimum value | Specify here the minimum value of the representation | |
| (automatically deactivated) | range. | |
|
|
| If the Automatically option has been activated, the system |
|
|
| will determine the minimum value. |
Grid lines |
|
| |
| Set automatically | If you activate Set automatically, the grid lines will be | |
|
|
| displayed automatically with an optimum spacing. |
|
|
| If you deactivate Set automatically, you can use Main line |
|
|
| spacing or Auxiliary line spacing to specify the grid line |
|
|
| spacing. |
| Main line spacing | You can activate the display of the grid lines for the main | |
|
|
| line spacing here. |
|
|
| If you deactivate the Set automatically option, you can |
|
|
| specify the grid line spacing for the main line spacing. |
|
|
| Note: |
|
|
| The spacing that you specify for the grid lines in the main |
|
|
| line spacing must be a multiple of the spacing that you |
|
|
| specify for the grid lines in the auxiliary line spacing. |
CamTool | |
Configuration Manual, 12.2004, |
