Traffic engineering
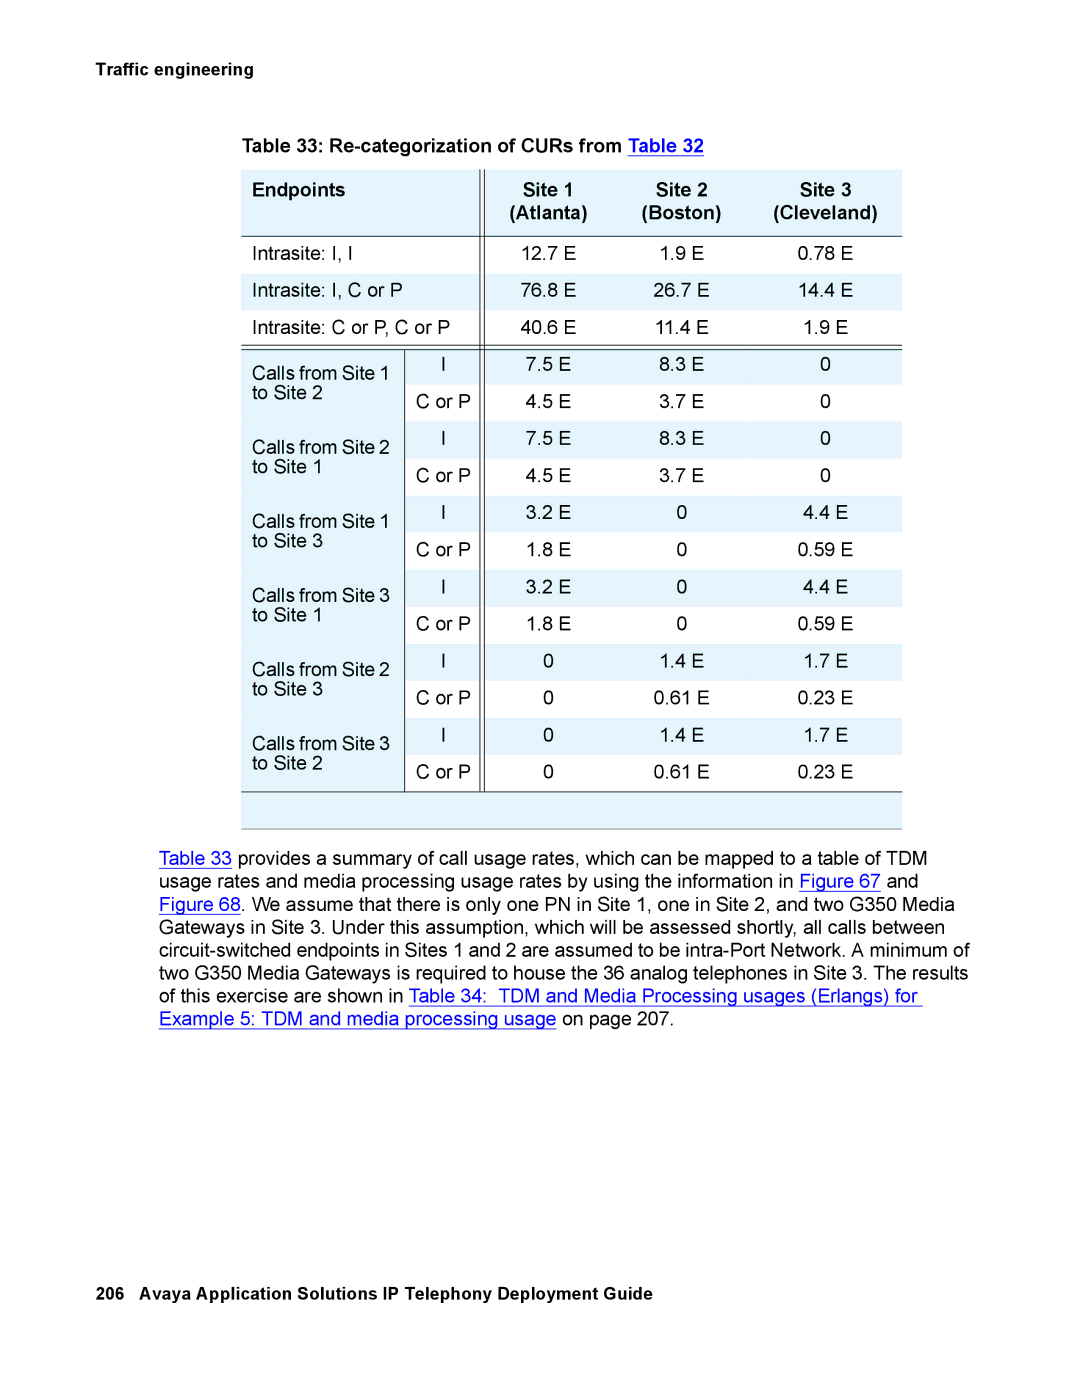
Table 33: |
| |||
|
|
|
|
|
Endpoints |
| Site 1 | Site 2 | Site 3 |
|
| (Atlanta) | (Boston) | (Cleveland) |
|
|
|
|
|
Intrasite: I, I |
| 12.7 E | 1.9 E | 0.78 E |
|
|
|
|
|
Intrasite: I, C or P |
| 76.8 E | 26.7 E | 14.4 E |
|
|
|
|
|
Intrasite: C or P, C or P | 40.6 E | 11.4 E | 1.9 E | |
|
|
|
|
|
|
|
|
|
|
Calls from Site 1 | I | 7.5 E | 8.3 E | 0 |
|
|
|
| |
to Site 2 | C or P | 4.5 E | 3.7 E | 0 |
| ||||
|
|
|
|
|
Calls from Site 2 | I | 7.5 E | 8.3 E | 0 |
|
|
|
| |
to Site 1 | C or P | 4.5 E | 3.7 E | 0 |
| ||||
|
|
|
|
|
Calls from Site 1 | I | 3.2 E | 0 | 4.4 E |
|
|
|
| |
to Site 3 | C or P | 1.8 E | 0 | 0.59 E |
| ||||
|
|
|
|
|
Calls from Site 3 | I | 3.2 E | 0 | 4.4 E |
|
|
|
| |
to Site 1 | C or P | 1.8 E | 0 | 0.59 E |
| ||||
|
|
|
|
|
Calls from Site 2 | I | 0 | 1.4 E | 1.7 E |
|
|
|
| |
to Site 3 | C or P | 0 | 0.61 E | 0.23 E |
| ||||
|
|
|
|
|
Calls from Site 3 | I | 0 | 1.4 E | 1.7 E |
|
|
|
| |
to Site 2 | C or P | 0 | 0.61 E | 0.23 E |
| ||||
|
|
|
|
|
|
|
|
|
|
Table 33 provides a summary of call usage rates, which can be mapped to a table of TDM usage rates and media processing usage rates by using the information in Figure 67 and Figure 68. We assume that there is only one PN in Site 1, one in Site 2, and two G350 Media Gateways in Site 3. Under this assumption, which will be assessed shortly, all calls between