Call usage rates
It is assumed that half of each individual station’s usage is associated with calls that the station generates, and the other half is associated with calls that the station receives. Therefore, half of the 97 Erlangs of station usage (that is, 49 Erlangs) in the Atlanta site corresponds to intercom calls originated in the Atlanta site. Similarly, half of the 36 Erlangs of station usage (that is, 18 Erlangs) in the Boston site corresponds to intercom calls originated in Boston, and half of the 18 Erlangs of station usage (that is, 9 Erlangs) in the Cleveland site corresponds to intercom calls originated in Cleveland.
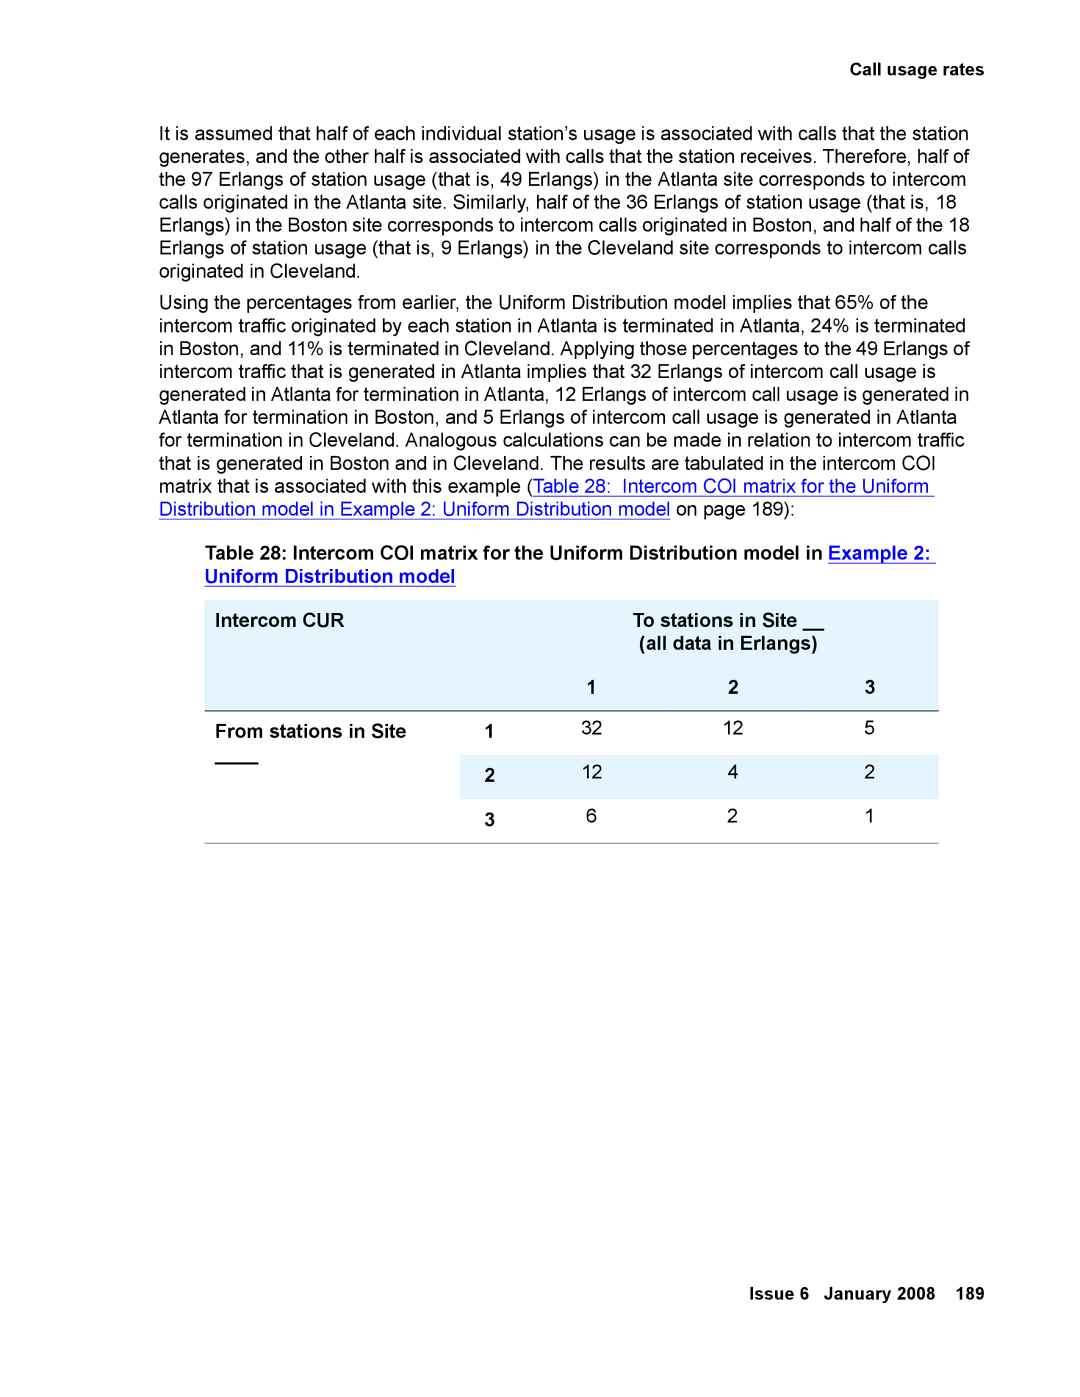
Using the percentages from earlier, the Uniform Distribution model implies that 65% of the intercom traffic originated by each station in Atlanta is terminated in Atlanta, 24% is terminated in Boston, and 11% is terminated in Cleveland. Applying those percentages to the 49 Erlangs of intercom traffic that is generated in Atlanta implies that 32 Erlangs of intercom call usage is generated in Atlanta for termination in Atlanta, 12 Erlangs of intercom call usage is generated in Atlanta for termination in Boston, and 5 Erlangs of intercom call usage is generated in Atlanta for termination in Cleveland. Analogous calculations can be made in relation to intercom traffic that is generated in Boston and in Cleveland. The results are tabulated in the intercom COI matrix that is associated with this example (Table 28: Intercom COI matrix for the Uniform Distribution model in Example 2: Uniform Distribution model on page 189):
Table 28: Intercom COI matrix for the Uniform Distribution model in Example 2: Uniform Distribution model
Intercom CUR |
|
| To stations in Site __ |
| |
|
|
| (all data in Erlangs) |
| |
|
| 1 | 2 | 3 | |
|
|
|
|
| |
From stations in Site | 1 | 32 | 12 | 5 | |
____ |
|
|
|
| |
2 | 12 | 4 | 2 | ||
| |||||
|
|
|
|
| |
| 3 | 6 | 2 | 1 | |
|
|
|
|
|
Issue 6 January 2008 189