HPIIISi TWINAX CARD
7.7.2TUTORIAL: PRIMARY BAR CHARTS
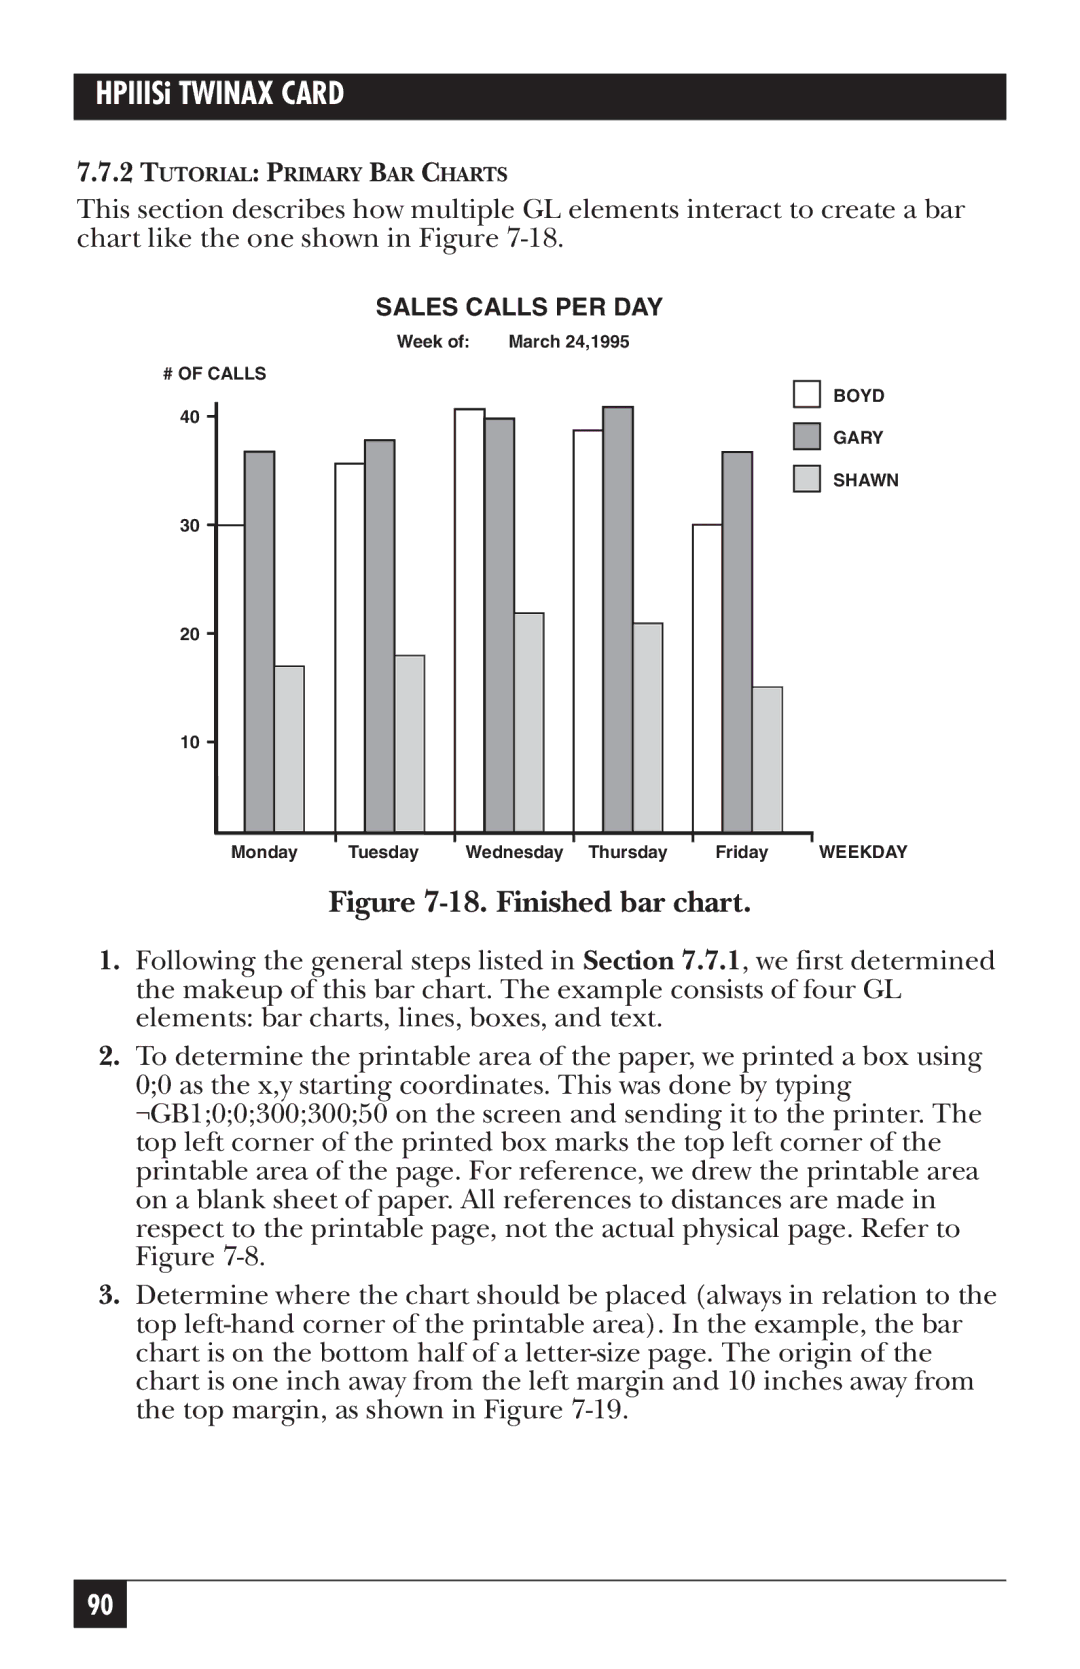
This section describes how multiple GL elements interact to create a bar chart like the one shown in Figure
SALES CALLS PER DAY
Week of: | March 24,1995 |
# OF CALLS
40 |
|
|
|
|
30 |
|
|
|
|
20 |
|
|
|
|
10 |
|
|
|
|
Monday | Tuesday | Wednesday | Thursday | Friday |
Figure 7-18. Finished bar chart.
BOYD
GARY
SHAWN
WEEKDAY
1.Following the general steps listed in Section 7.7.1, we first determined the makeup of this bar chart. The example consists of four GL elements: bar charts, lines, boxes, and text.
2.To determine the printable area of the paper, we printed a box using 0;0 as the x,y starting coordinates. This was done by typing ¬GB1;0;0;300;300;50 on the screen and sending it to the printer. The top left corner of the printed box marks the top left corner of the printable area of the page. For reference, we drew the printable area on a blank sheet of paper. All references to distances are made in respect to the printable page, not the actual physical page. Refer to Figure
3.Determine where the chart should be placed (always in relation to the top
90
