CHAPTER 7: Advanced Features
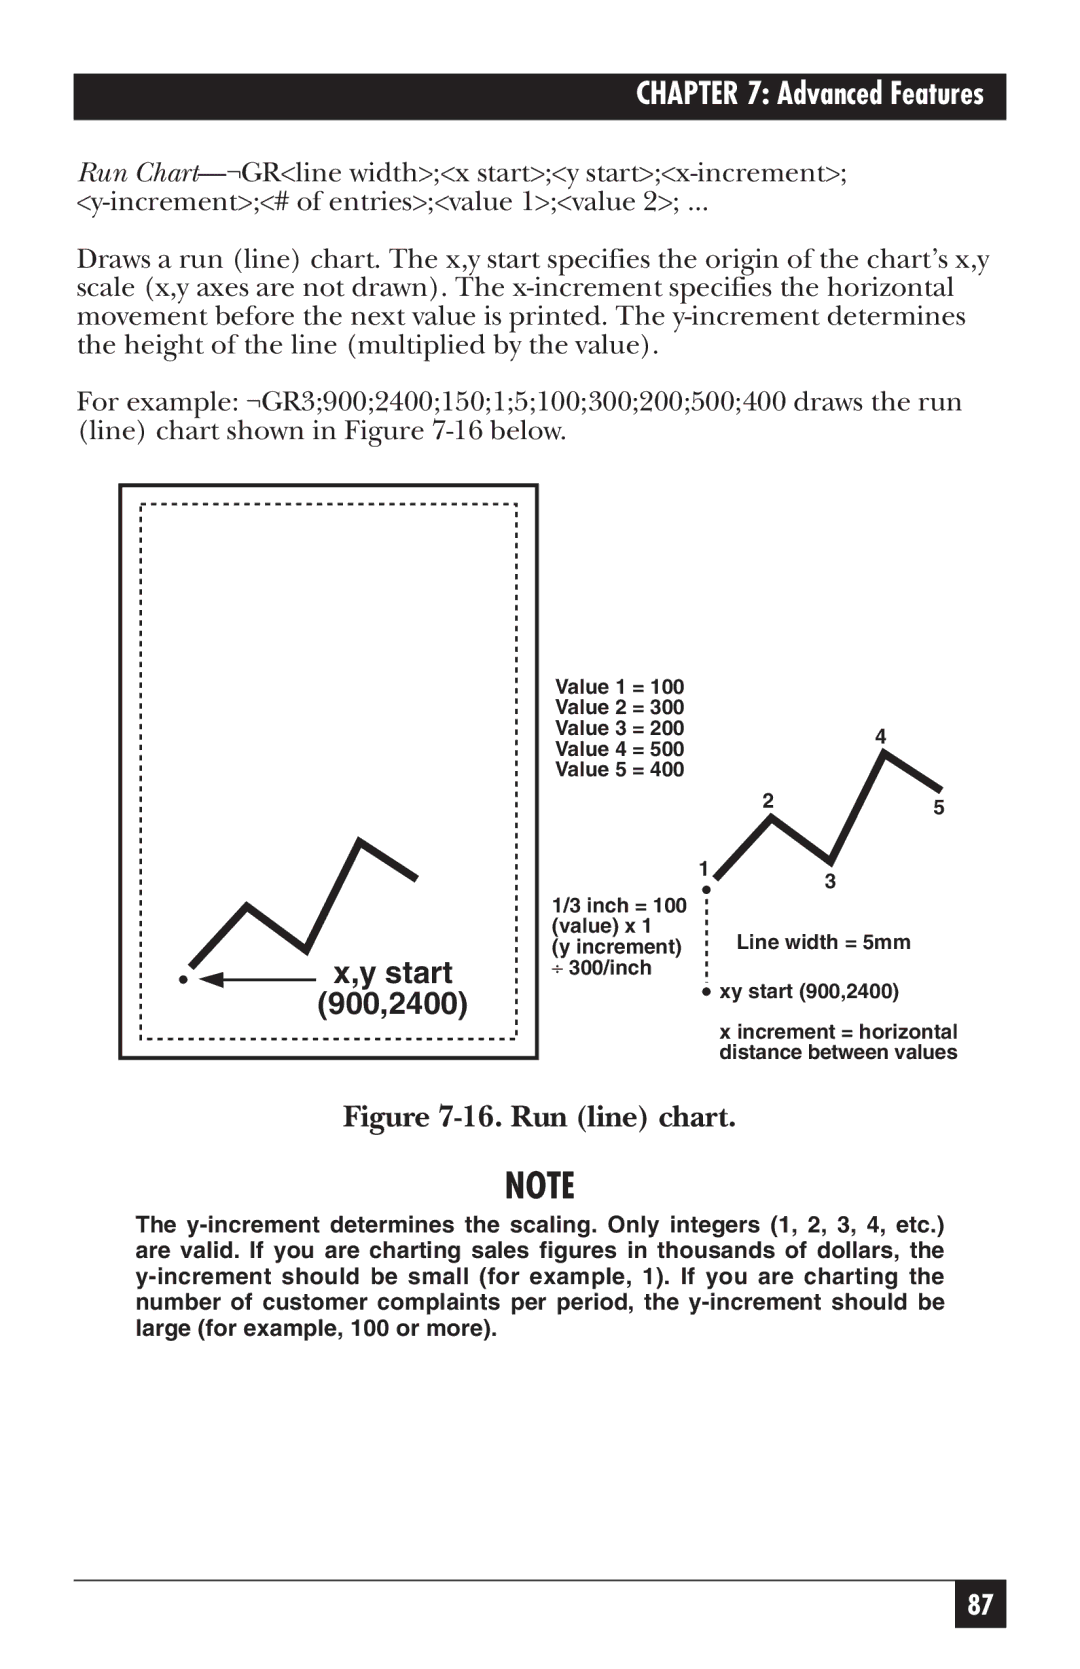
Run
Draws a run (line) chart. The x,y start specifies the origin of the chart’s x,y scale (x,y axes are not drawn). The
For example: ¬GR3;900;2400;150;1;5;100;300;200;500;400 draws the run (line) chart shown in Figure
| Value 1 = 100 |
|
|
|
| Value 2 = 300 |
|
|
|
| Value 3 = 200 |
| 4 |
|
| Value 4 = 500 |
|
| |
|
|
|
| |
| Value 5 = 400 |
|
|
|
|
|
| 2 | 5 |
|
|
|
| |
|
| 1 | 3 |
|
| 1/3 inch = 100 |
|
| |
|
|
|
| |
| (value) x 1 |
| Line width = 5mm |
|
x,y start | (y increment) |
|
| |
⎟ 300/inch |
| xy start (900,2400) |
| |
(900,2400) |
|
|
| |
|
| x increment = horizontal | ||
|
|
| ||
|
|
| distance between values | |
Figure 7-16. Run (line) chart.
NOTE
The
87