CHAPTER 7: Advanced Features
Pie
segments>;<segment value 1>;<segment value 2>;....
Draws a pie chart around the x,y center with the specified radius (in n/300 inches), number of segments (maximum of 9), and segment values. Segment values are entered as numerics and converted to percentages; they can range from 0 to 100. <line width> must be specified in mm.
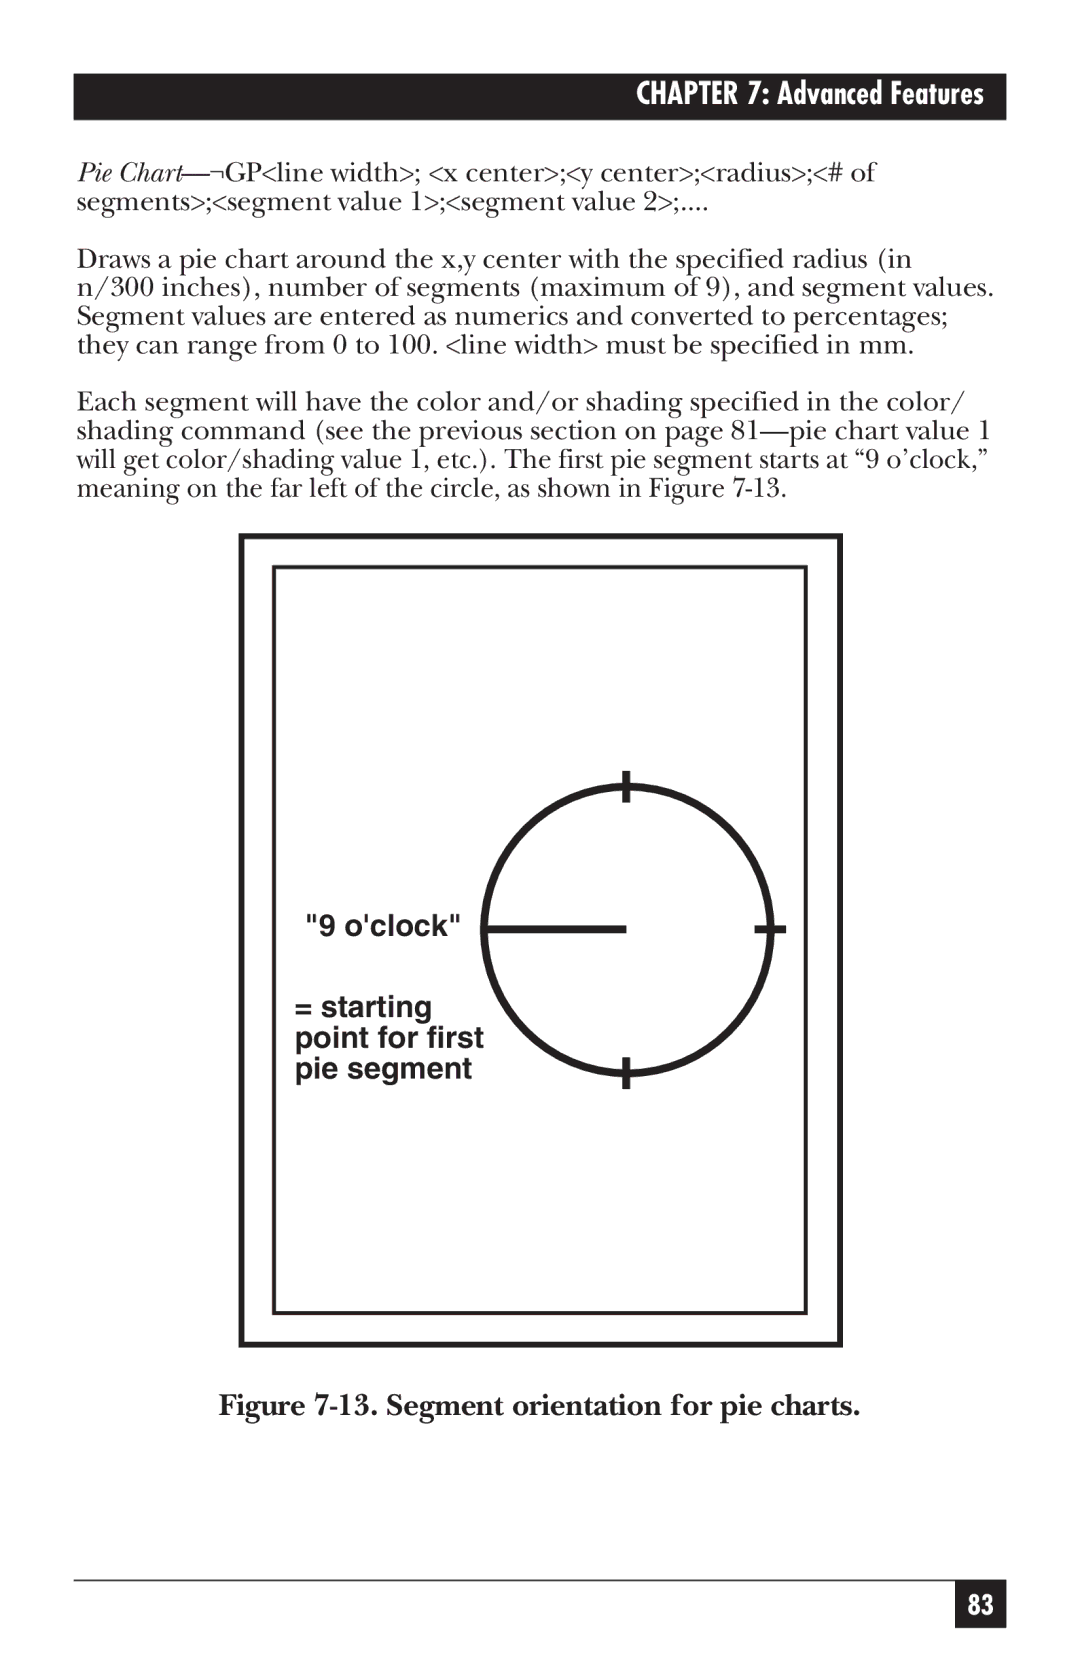
Each segment will have the color and/or shading specified in the color/ shading command (see the previous section on page
"9 o'clock"
=starting point for first pie segment
Figure 7-13. Segment orientation for pie charts.
83