show processes
Age: 662314 msec, Runtime: 3841 msec
State: Running, Priority: Normal
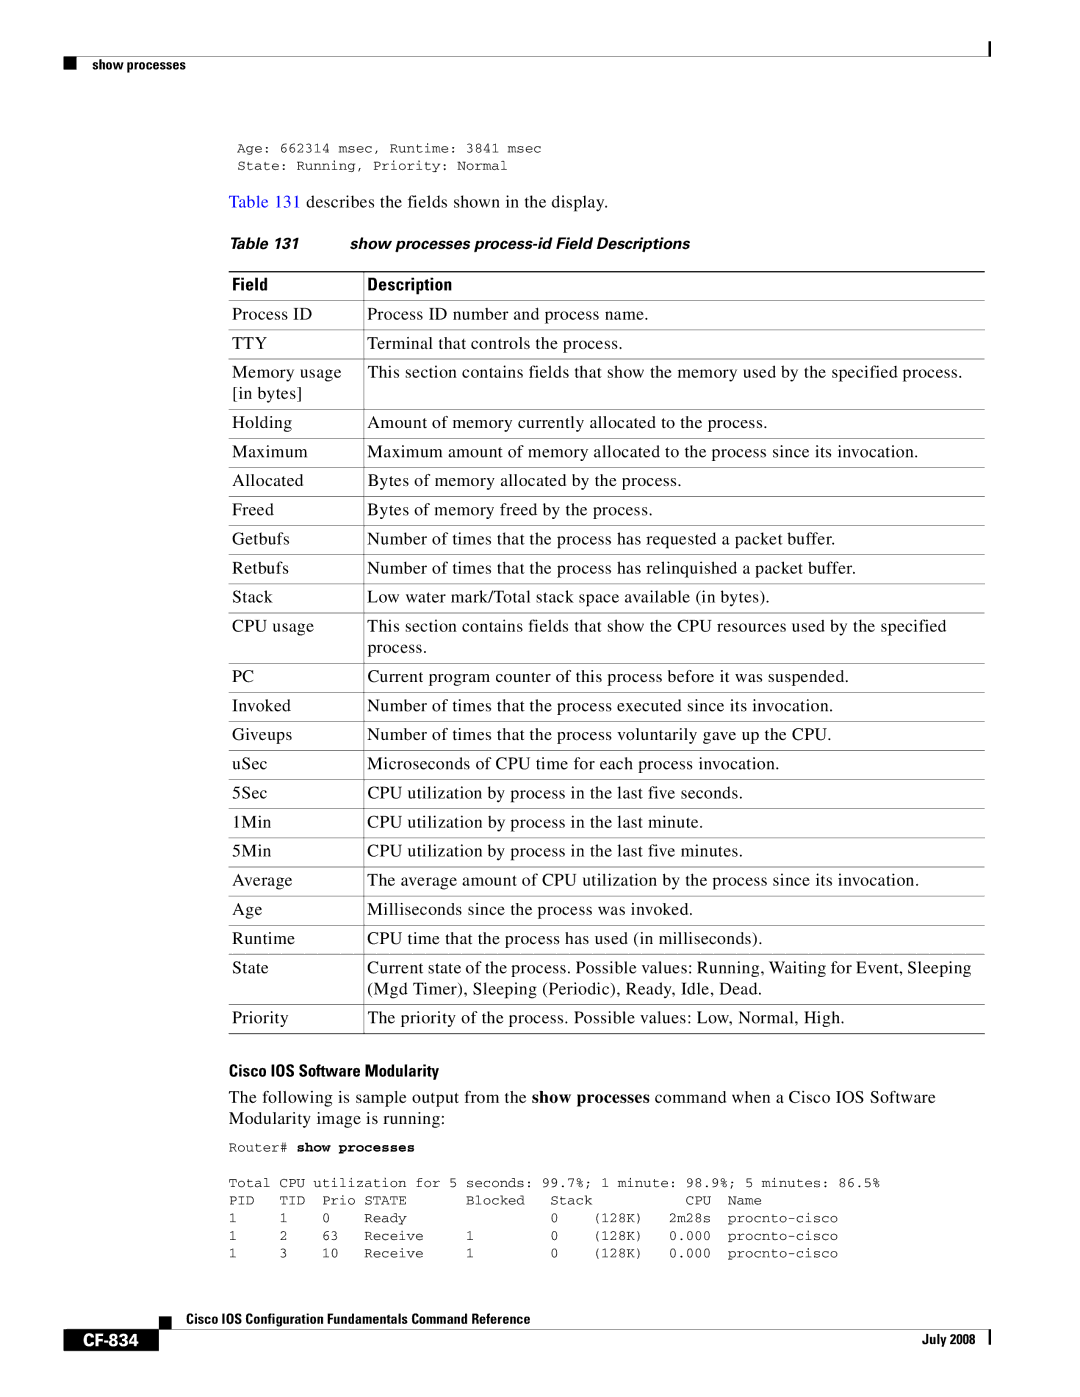
Table 131 describes the fields shown in the display.
Table 131 | show processes | |
|
|
|
Field |
| Description |
|
|
|
Process ID |
| Process ID number and process name. |
|
|
|
TTY |
| Terminal that controls the process. |
|
|
|
Memory usage |
| This section contains fields that show the memory used by the specified process. |
[in bytes] |
|
|
|
|
|
Holding |
| Amount of memory currently allocated to the process. |
|
|
|
Maximum |
| Maximum amount of memory allocated to the process since its invocation. |
|
|
|
Allocated |
| Bytes of memory allocated by the process. |
|
|
|
Freed |
| Bytes of memory freed by the process. |
|
|
|
Getbufs |
| Number of times that the process has requested a packet buffer. |
|
|
|
Retbufs |
| Number of times that the process has relinquished a packet buffer. |
|
|
|
Stack |
| Low water mark/Total stack space available (in bytes). |
|
|
|
CPU usage |
| This section contains fields that show the CPU resources used by the specified |
|
| process. |
|
|
|
PC |
| Current program counter of this process before it was suspended. |
|
|
|
Invoked |
| Number of times that the process executed since its invocation. |
|
|
|
Giveups |
| Number of times that the process voluntarily gave up the CPU. |
|
|
|
uSec |
| Microseconds of CPU time for each process invocation. |
|
|
|
5Sec |
| CPU utilization by process in the last five seconds. |
|
|
|
1Min |
| CPU utilization by process in the last minute. |
|
|
|
5Min |
| CPU utilization by process in the last five minutes. |
|
|
|
Average |
| The average amount of CPU utilization by the process since its invocation. |
|
|
|
Age |
| Milliseconds since the process was invoked. |
|
|
|
Runtime |
| CPU time that the process has used (in milliseconds). |
|
|
|
State |
| Current state of the process. Possible values: Running, Waiting for Event, Sleeping |
|
| (Mgd Timer), Sleeping (Periodic), Ready, Idle, Dead. |
|
|
|
Priority |
| The priority of the process. Possible values: Low, Normal, High. |
|
|
|
Cisco IOS Software Modularity
The following is sample output from the show processes command when a Cisco IOS Software Modularity image is running:
Router# show processes
|
|
| Total | CPU utilization for 5 seconds: 99.7%; 1 minute: 98.9%; 5 minutes: 86.5% | ||||||||
|
|
| PID | TID | Prio | STATE | Blocked | Stack |
| CPU | Name | |
1 | 1 | 0 | Ready |
| 0 | (128K) | 2m28s | |||||
1 | 2 | 63 | Receive | 1 | 0 | (128K) | 0.000 | |||||
1 | 3 | 10 | Receive | 1 | 0 | (128K) | 0.000 | |||||
|
|
| Cisco IOS Configuration Fundamentals Command Reference |
|
|
|
|
| ||||
|
|
|
|
|
|
|
| |||||
|
|
|
|
|
|
|
|
|
|
|
|
|
|
|
|
|
|
|
|
|
|
|
| July 2008 |
|
|
|
|
|
|
|
|
|
|
|
| ||
