4.Key in the respective frequency and press ![]() . The display shows the number of data points entered.
. The display shows the number of data points entered.
5.Repeat steps 3 and 4 for each data point.
6.To calculate the mean, press ![]()
![]() 05
05 ![]() .
.
7.Press ![]() to find the standard deviation.
to find the standard deviation.
8.Press ![]() to find the standard error of the mean.
to find the standard error of the mean.
9.For a new case, go to step 2.
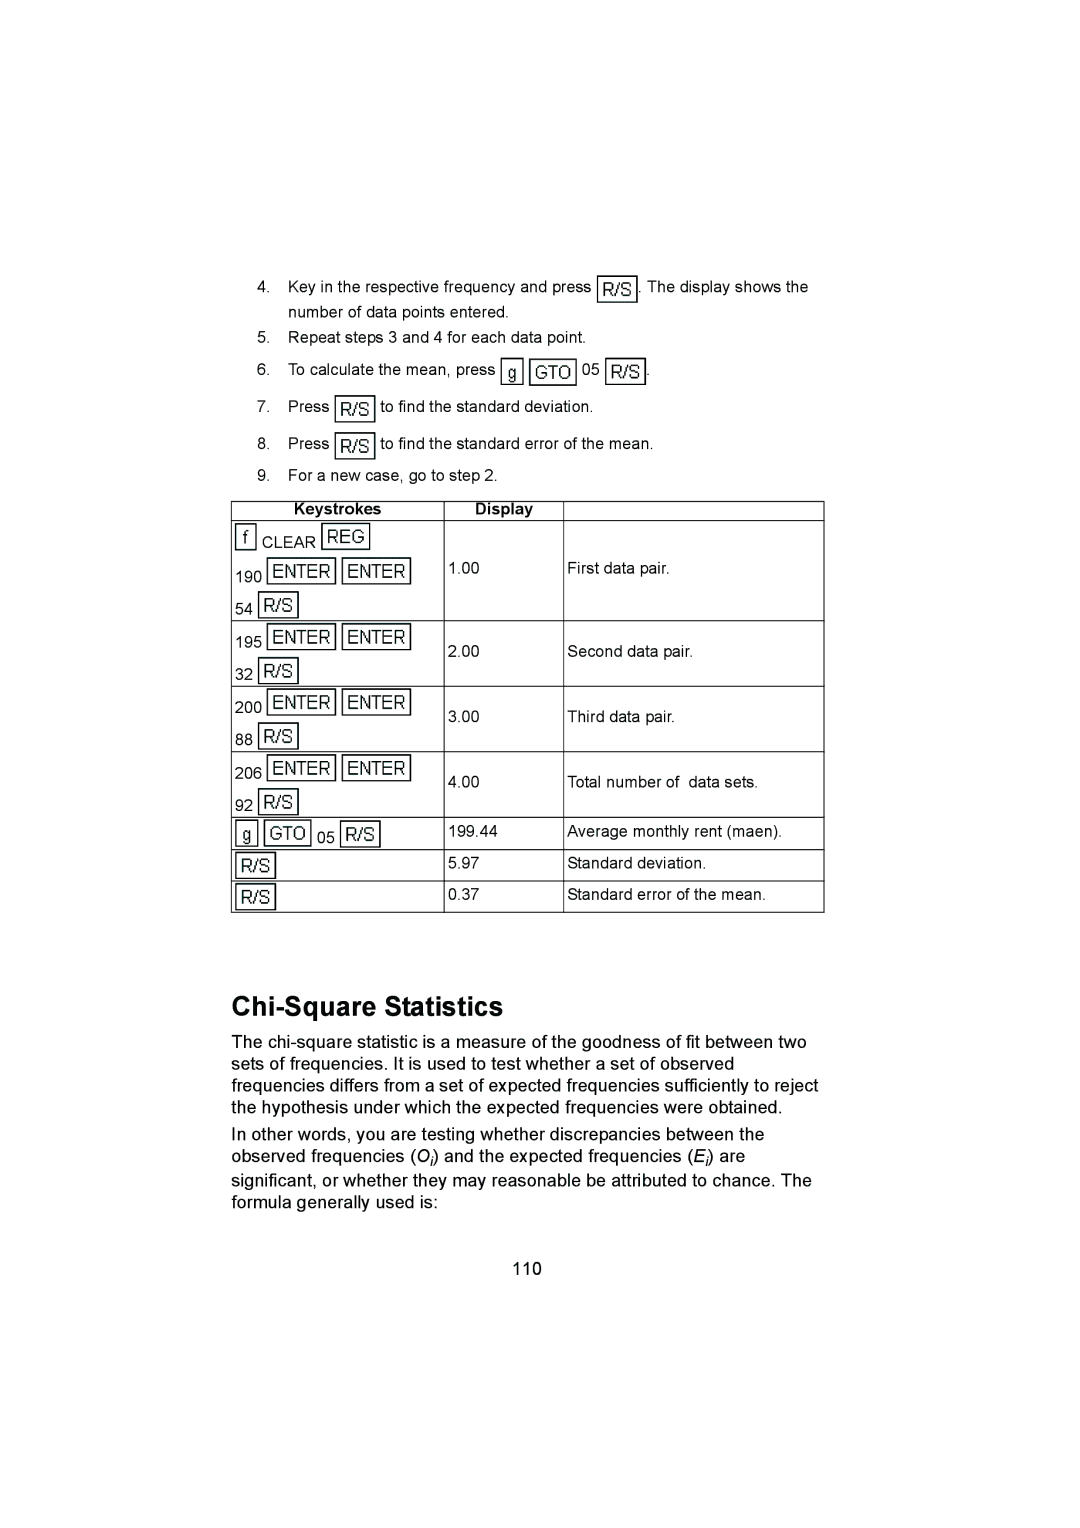
Keystrokes | Display |
|
CLEAR |
|
|
190 | 1.00 | First data pair. |
|
| |
54 |
|
|
195 | 2.00 | Second data pair. |
| ||
32 |
|
|
200 | 3.00 | Third data pair. |
| ||
88 |
|
|
206 | 4.00 | Total number of data sets. |
| ||
92 |
|
|
05 | 199.44 | Average monthly rent (maen). |
|
| |
| 5.97 | Standard deviation. |
|
|
|
| 0.37 | Standard error of the mean. |
|
|
|
Chi-Square Statistics
The
In other words, you are testing whether discrepancies between the observed frequencies (Oi) and the expected frequencies (Ei) are significant, or whether they may reasonable be attributed to chance. The formula generally used is:
110