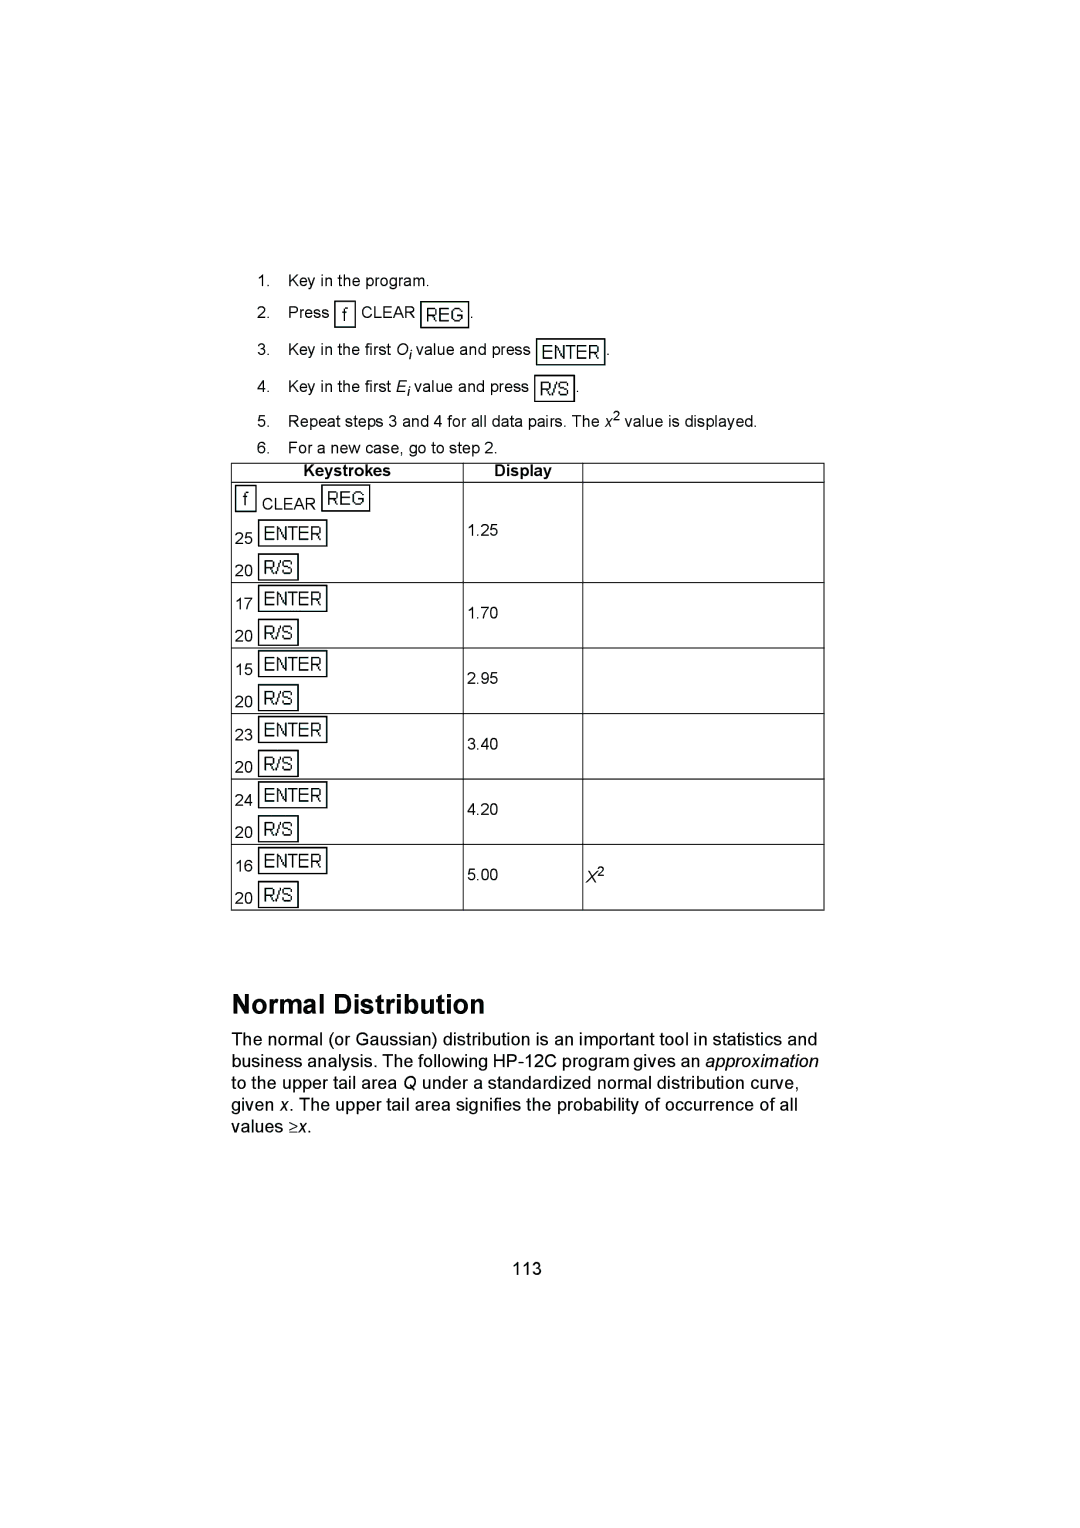
1.Key in the program.
2.Press ![]() CLEAR
CLEAR ![]() .
.
3.Key in the first Oi value and press ![]() .
.
4.Key in the first Ei value and press ![]() .
.
5.Repeat steps 3 and 4 for all data pairs. The x2 value is displayed.
6.For a new case, go to step 2.
KeystrokesDisplay
| CLEAR |
| |
25 | 1.25 |
| |
|
| ||
20 |
|
| |
17 | 1.70 |
| |
|
| ||
20 |
|
| |
15 | 2.95 |
| |
|
| ||
20 |
|
| |
23 | 3.40 |
| |
|
| ||
20 |
|
| |
24 | 4.20 |
| |
|
| ||
20 |
|
| |
16 | 5.00 | X2 | |
20 | |||
|
|
Normal Distribution
The normal (or Gaussian) distribution is an important tool in statistics and business analysis. The following
113