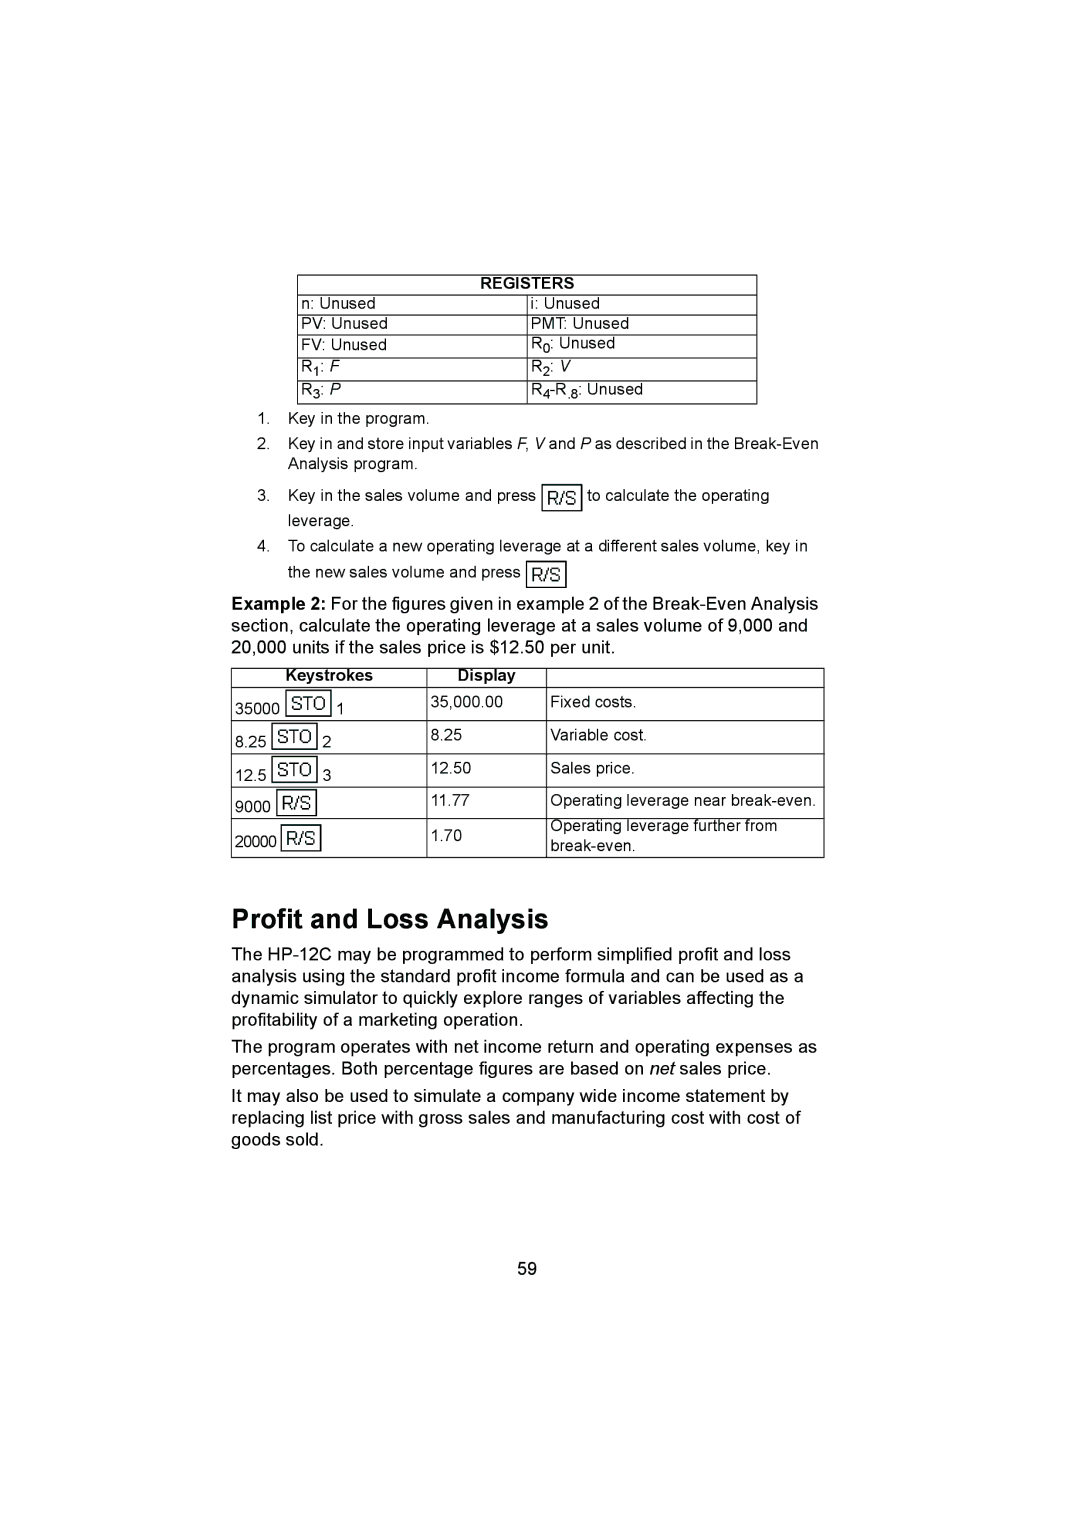
| REGISTERS | |
n: Unused |
| i: Unused |
PV: Unused |
| PMT: Unused |
FV: Unused |
| R0: Unused |
R1: F |
| R2: V |
R3: P |
| |
1.Key in the program.
2.Key in and store input variables F, V and P as described in the
3.Key in the sales volume and press ![]() to calculate the operating leverage.
to calculate the operating leverage.
4.To calculate a new operating leverage at a different sales volume, key in the new sales volume and press ![]()
Example 2: For the figures given in example 2 of the
| Keystrokes | Display |
|
35000 | 1 | 35,000.00 | Fixed costs. |
|
| ||
8.25 | 2 | 8.25 | Variable cost. |
|
| ||
12.5 | 3 | 12.50 | Sales price. |
|
| ||
9000 |
| 11.77 | Operating leverage near |
|
|
| |
20000 |
| 1.70 | Operating leverage further from |
| |||
|
|
Profit and Loss Analysis
The
The program operates with net income return and operating expenses as percentages. Both percentage figures are based on net sales price.
It may also be used to simulate a company wide income statement by replacing list price with gross sales and manufacturing cost with cost of goods sold.
59
