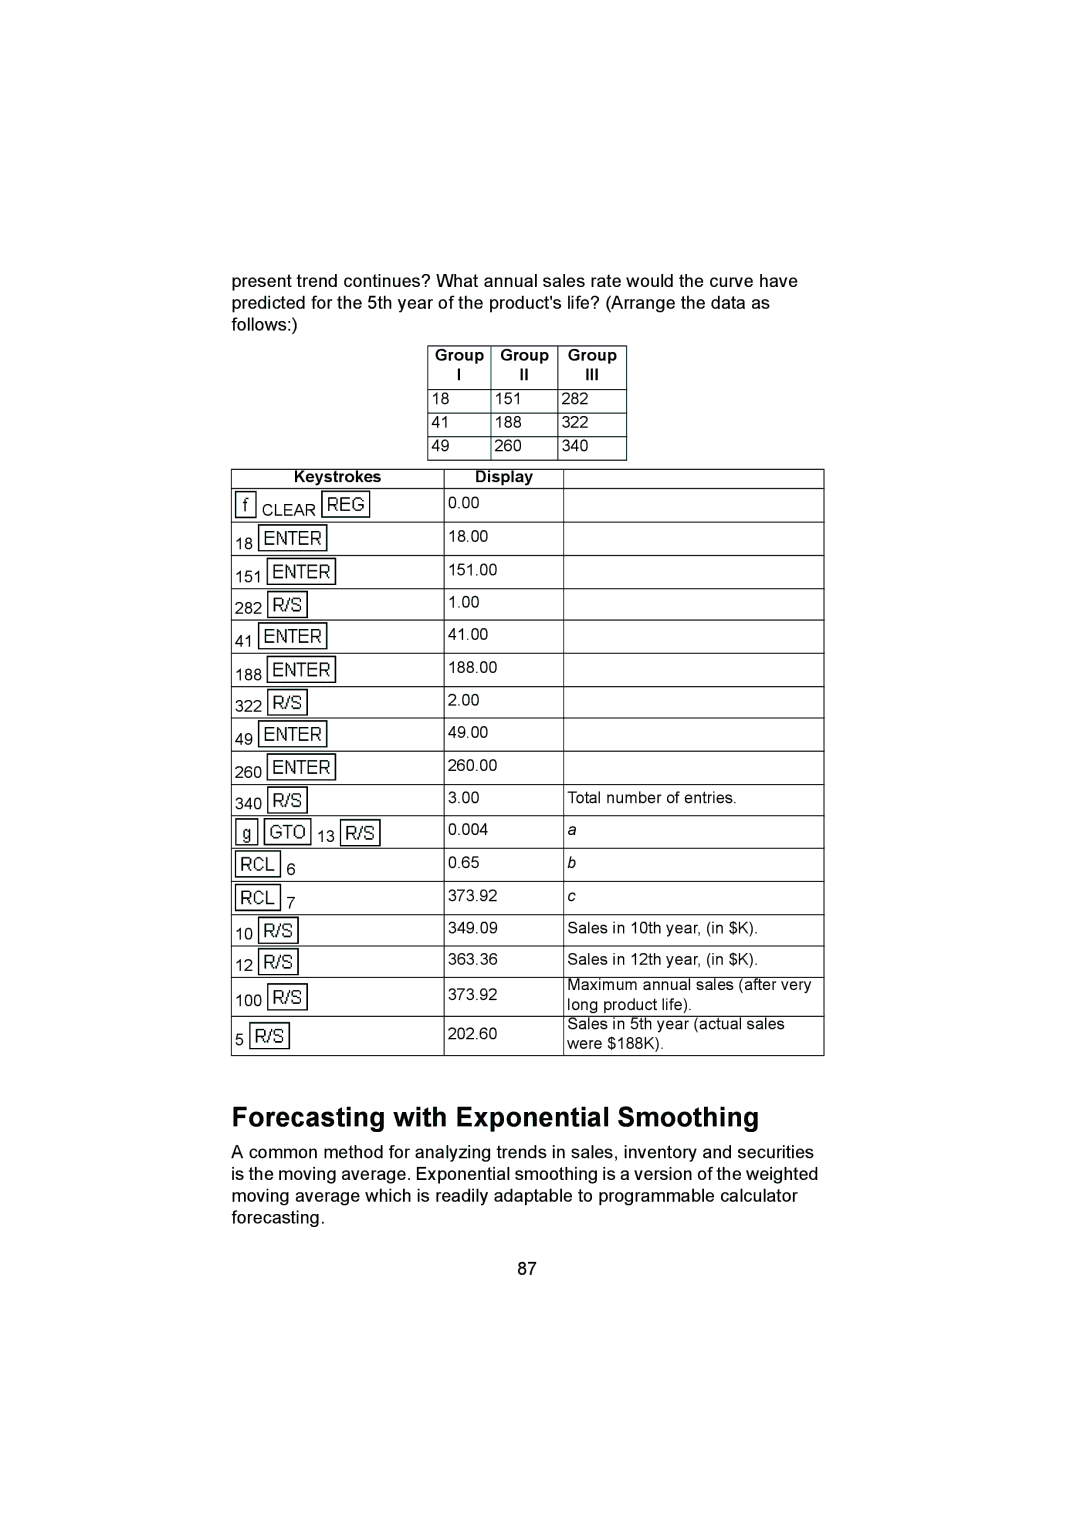
present trend continues? What annual sales rate would the curve have predicted for the 5th year of the product's life? (Arrange the data as follows:)
Group | Group | Group |
I | II | III |
18 | 151 | 282 |
41 | 188 | 322 |
49 | 260 | 340 |
Keystrokes | Display |
| |
CLEAR | 0.00 |
| |
|
| ||
18 | 18.00 |
| |
|
| ||
151 | 151.00 |
| |
|
| ||
282 | 1.00 |
| |
|
| ||
41 | 41.00 |
| |
|
| ||
188 | 188.00 |
| |
|
| ||
322 | 2.00 |
| |
|
| ||
49 | 49.00 |
| |
|
| ||
260 | 260.00 |
| |
|
| ||
340 | 3.00 | Total number of entries. | |
|
| ||
13 | 0.004 | a | |
|
| ||
6 | 0.65 | b | |
|
| ||
7 | 373.92 | c | |
|
| ||
10 | 349.09 | Sales in 10th year, (in $K). | |
|
| ||
12 | 363.36 | Sales in 12th year, (in $K). | |
|
| ||
100 | 373.92 | Maximum annual sales (after very | |
long product life). | |||
| |||
5 | 202.60 | Sales in 5th year (actual sales | |
were $188K). | |||
|
Forecasting with Exponential Smoothing
A common method for analyzing trends in sales, inventory and securities is the moving average. Exponential smoothing is a version of the weighted moving average which is readily adaptable to programmable calculator forecasting.
87