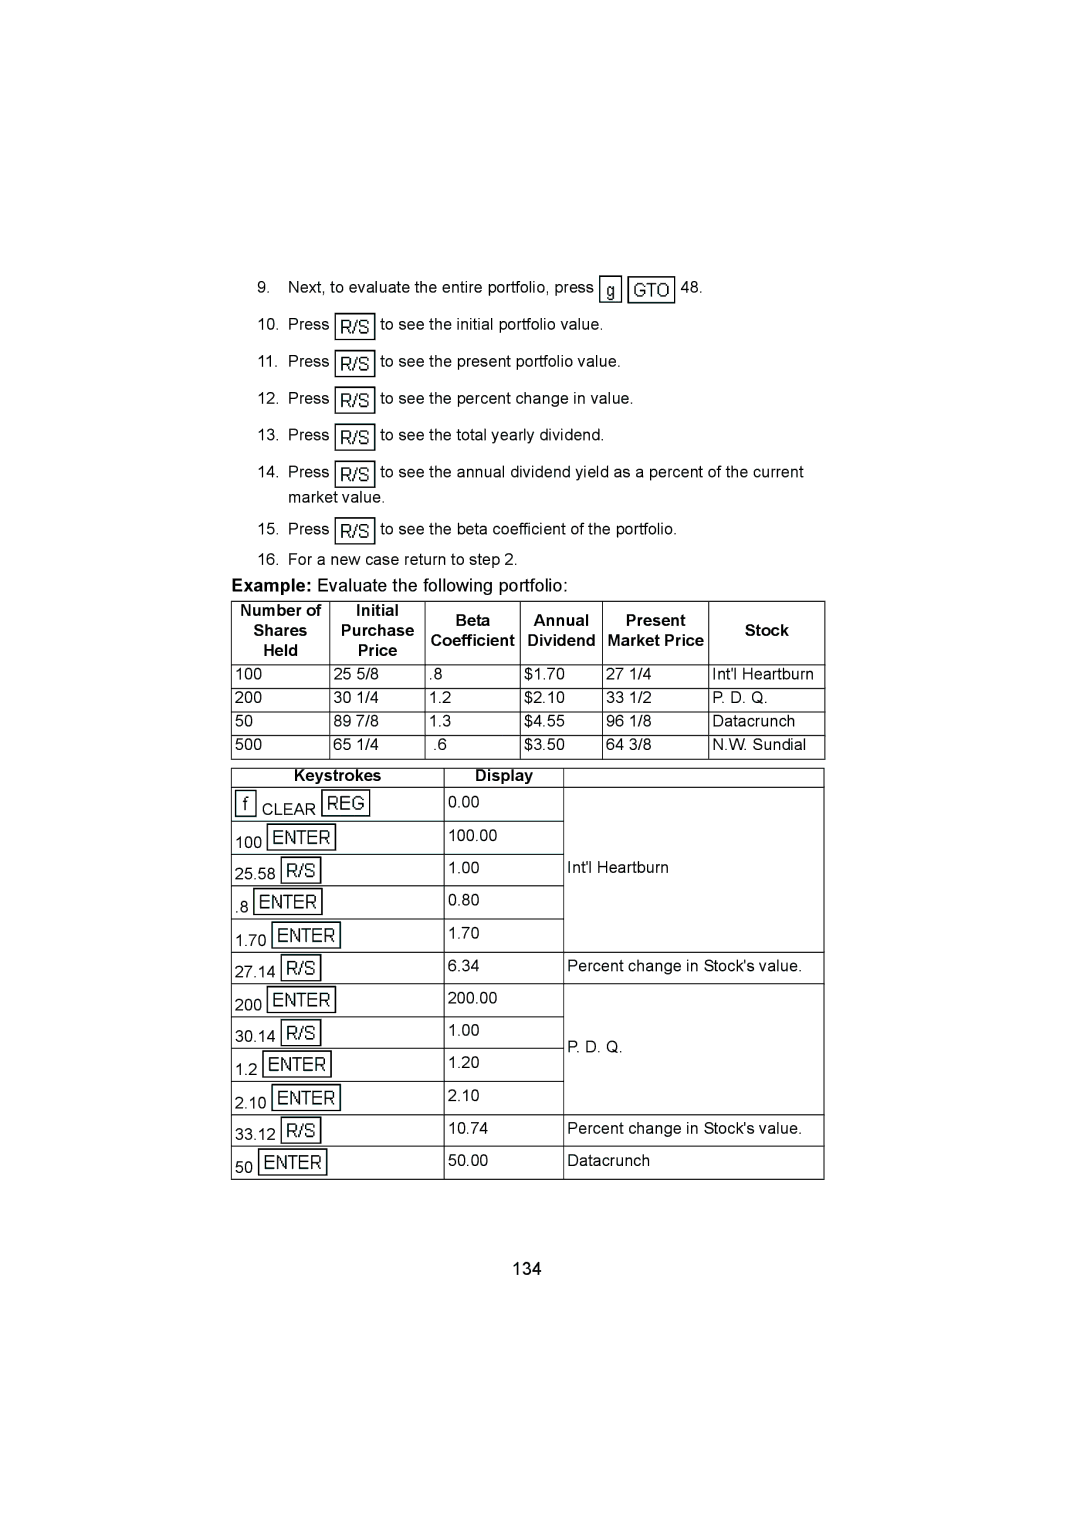
9.Next, to evaluate the entire portfolio, press ![]()
![]() 48.
48.
10.Press ![]() to see the initial portfolio value.
to see the initial portfolio value.
11.Press ![]() to see the present portfolio value.
to see the present portfolio value.
12.Press ![]() to see the percent change in value.
to see the percent change in value.
13.Press ![]() to see the total yearly dividend.
to see the total yearly dividend.
14.Press ![]() to see the annual dividend yield as a percent of the current market value.
to see the annual dividend yield as a percent of the current market value.
15.Press ![]() to see the beta coefficient of the portfolio.
to see the beta coefficient of the portfolio.
16.For a new case return to step 2.
Example: Evaluate the following portfolio:
Number of | Initial |
| Beta | Annual | Present |
| |
Shares | Purchase |
| Stock | ||||
Coefficient | Dividend | Market Price | |||||
Held | Price |
|
|
|
|
|
|
100 | 25 5/8 | .8 |
| $1.70 | 27 1/4 | Int'l Heartburn | |
200 | 30 1/4 | 1.2 | $2.10 | 33 1/2 | P. D. Q. | ||
50 | 89 7/8 | 1.3 | $4.55 | 96 1/8 | Datacrunch | ||
500 | 65 1/4 | .6 | $3.50 | 64 3/8 | N.W. Sundial | ||
|
|
|
|
|
| ||
Keystrokes |
| Display |
|
|
| ||
CLEAR |
|
| 0.00 |
|
|
|
|
|
|
|
|
|
|
| |
100 |
|
| 100.00 |
|
|
|
|
|
|
|
|
|
|
| |
25.58 |
|
| 1.00 |
| Int'l Heartburn |
| |
|
|
|
|
|
|
| |
.8 |
|
| 0.80 |
|
|
|
|
|
|
|
|
|
|
| |
1.70 |
|
| 1.70 |
|
|
|
|
|
|
|
|
|
|
| |
27.14 |
|
| 6.34 |
| Percent change in Stock's value. | ||
|
|
|
|
|
|
| |
200 |
|
| 200.00 |
|
|
|
|
|
|
|
|
|
|
| |
30.14 |
|
| 1.00 |
| P. D. Q. |
| |
|
|
|
|
| |||
1.2 |
|
| 1.20 |
|
| ||
|
|
|
|
|
| ||
|
|
|
|
|
|
| |
2.10 |
|
| 2.10 |
|
|
|
|
|
|
|
|
|
|
| |
33.12 |
|
| 10.74 |
| Percent change in Stock's value. | ||
|
|
|
|
|
|
| |
50 |
|
| 50.00 |
| Datacrunch |
| |
|
|
|
|
|
|
| |