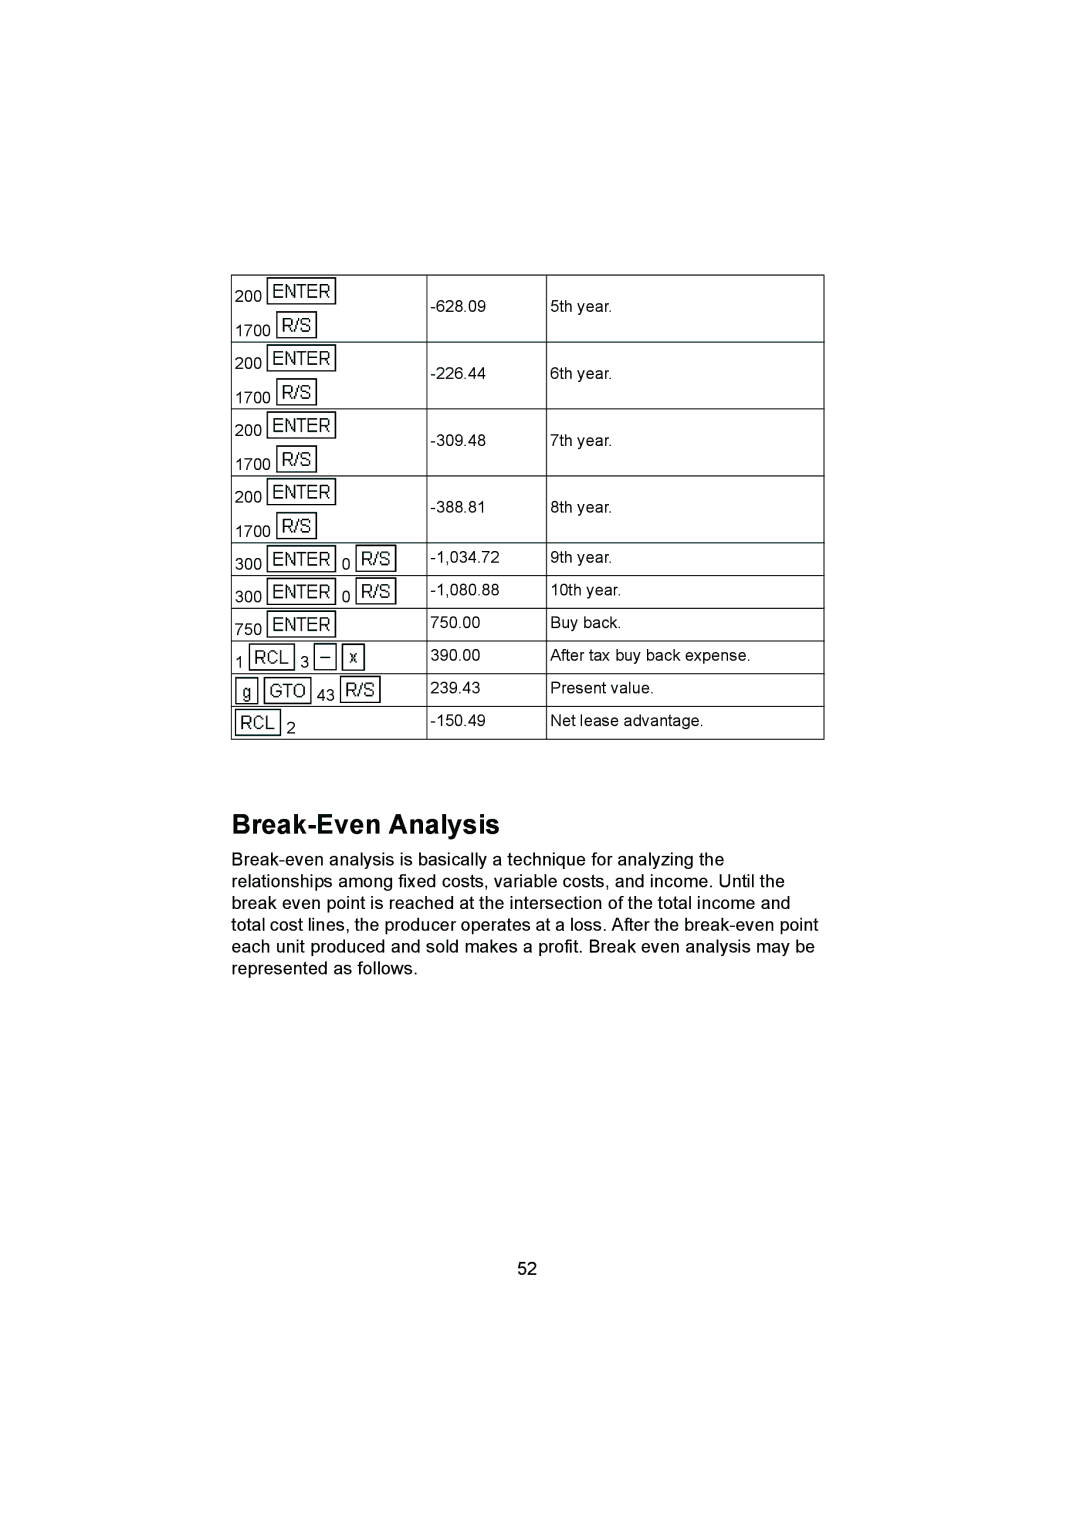
200 | | | | | -628.09 | 5th year. |
| | | | |
1700 | | | | | | |
200 | | | | | -226.44 | 6th year. |
| | | | |
1700 | | | | | | |
200 | | | | | -309.48 | 7th year. |
| | | | |
1700 | | | | | | |
200 | | | | | -388.81 | 8th year. |
| | | | |
1700 | | | | | | |
300 | | | | 0 | -1,034.72 | 9th year. |
| | | | |
300 | | | | 0 | -1,080.88 | 10th year. |
| | | | |
750 | | | | | 750.00 | Buy back. |
| | | | | |
1 | | 3 | | | 390.00 | After tax buy back expense. |
| | | | |
| | | 43 | | 239.43 | Present value. |
| | | | | |
| 2 | | | | -150.49 | Net lease advantage. |
| | | | | |
Break-Even Analysis
Break-even analysis is basically a technique for analyzing the relationships among fixed costs, variable costs, and income. Until the break even point is reached at the intersection of the total income and total cost lines, the producer operates at a loss. After the break-even point each unit produced and sold makes a profit. Break even analysis may be represented as follows.