Advanced Navigator Functions
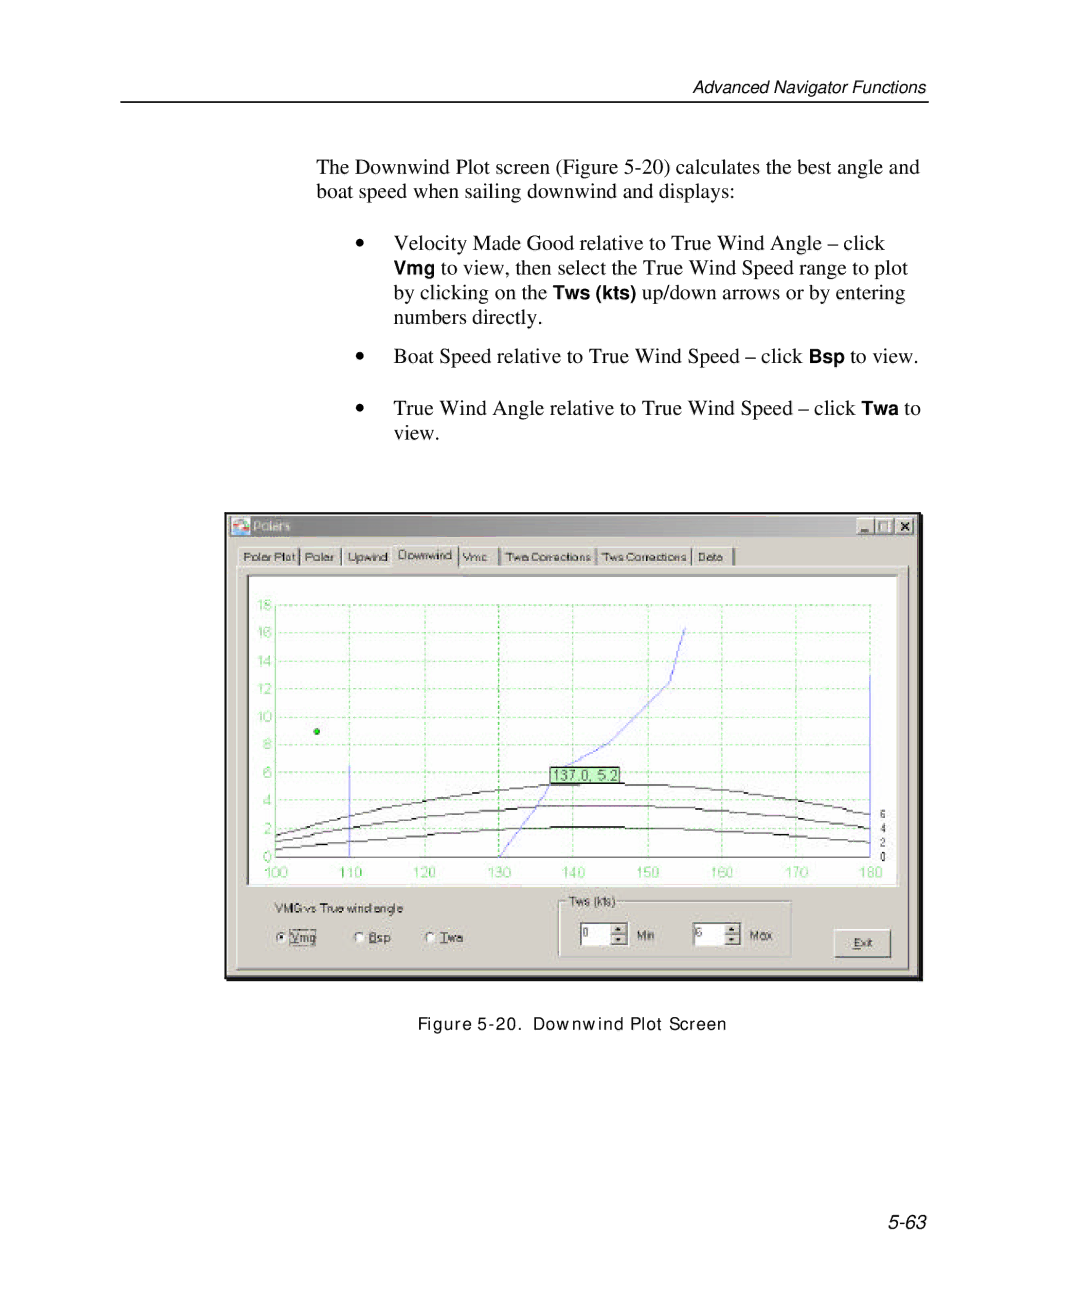
The Downwind Plot screen (Figure
∙Velocity Made Good relative to True Wind Angle – click Vmg to view, then select the True Wind Speed range to plot by clicking on the Tws (kts) up/down arrows or by entering numbers directly.
∙Boat Speed relative to True Wind Speed – click Bsp to view.
∙True Wind Angle relative to True Wind Speed – click Twa to view.